
Industry: Aerospace
Platform: WPF
In civil aircraft flight testing, the collection of extensive sensor data to ensure performance and safety compliance is integral to modern safety requirements, as well as stringent modern design and test regulations.
Processing flight test data presents consistent challenges. These include rendering vast amounts of sensor data in real-time with necessary overlays and interactions, ensuring usability, and extracting vital information for informed decision-making during and after the flight.
The Chinese government-owned aerospace enterprise, the Commercial Aircraft Corporation of China (COMAC), approached SciChart to improve the visualization and analysis of their flight test data.
This case study reveals exactly how SciChart’s high-performance charting library supported the streamlining of both real-time monitoring and post-flight analysis.
The Challenge: Handling Complex, High-volume Data with Different Sampling Rates and Custom Interactions.

COMAC, on behalf of the Chinese Government, needed to design and develop new software tools for test data processing and analysis across its civil aircraft dataset.
Key challenges included:
- Managing Data Complexity and Volume: Enhanced Aircraft Flight Recorder (EAFR), including Digital Flight Data Recorder (DFDR) data spans terabytes, making efficient processing difficult with traditional tools. The use of advanced aviation systems has led to a massive increase in flight test data, ranging from low-frequency parameters to high-frequency ones. Managing such large amounts of complex time series data across varying sampling rates created difficulties in processing in both real-time and retrospective analysis.
- Real-time Visualization: Previous solutions, including manual scripting for data analysis, lacked a unified software platform. This also struggled with visualizing high-frequency data across aerodynamic parameters, such as parametric flight data and control surfaces against date-time, hindering real-time review and rapid decision-making.
- Inconsistent Sampling Rates: Flight test data came from various sensors with different sampling rates. This complicated data alignment and synchronization, impacting accurate analysis.
- Memory Management: Large data files risked memory overflow, making it challenging to load, process, and visualize data efficiently, including when zooming or panning through historical data sets given issues with Level of Detail algorithms.
- Post-flight Analysis: Accurate replay and detailed analysis of the recorded data were essential for identifying performance trends and potential issues across multiple flight tests.
The Solution: Advanced Data Visualization for Real-time Charting
COMAC integrated SciChart into the flight test data processing workflow to address these challenges through its advanced data visualization and real-time charting capabilities.
- Real-Time Data Handling: SciChart enabled continuous real-time updates from flight sensors and files, allowing engineers to monitor key performance metrics during and post-flight tests. This feature was critical for assessing control responses, engine performance, and overall aircraft stability in real-time.
- Multi-Axis and 3D Data Visualization: SciChart’s ability to render multi-axis charts and 3D surface meshes allowed for the simultaneous visualization of different flight parameters. Engineers could observe sensor data from multiple perspectives, improving the accuracy of aerodynamic and structural analysis.
- Efficient Data Loading and Visualization: SciChart enabled hierarchical sampling methods and memory management, allowing dynamic adjustment of data for real-time visualization across a range of frequencies. As the only high-performance 64-bit library, SciChart was optimized for complex data sets, ensuring data integrity.
- Time Alignment for Consistent Analysis: To manage varying sampling rates, the solution implemented time alignment strategies in SciChart that used the highest sampling rate as a baseline, ensuring data consistency before visualization and further analysis. Synchronization of data sets was enabled across chart types with linking of time-series data cross-axis through customization enabled by the SciChart API.
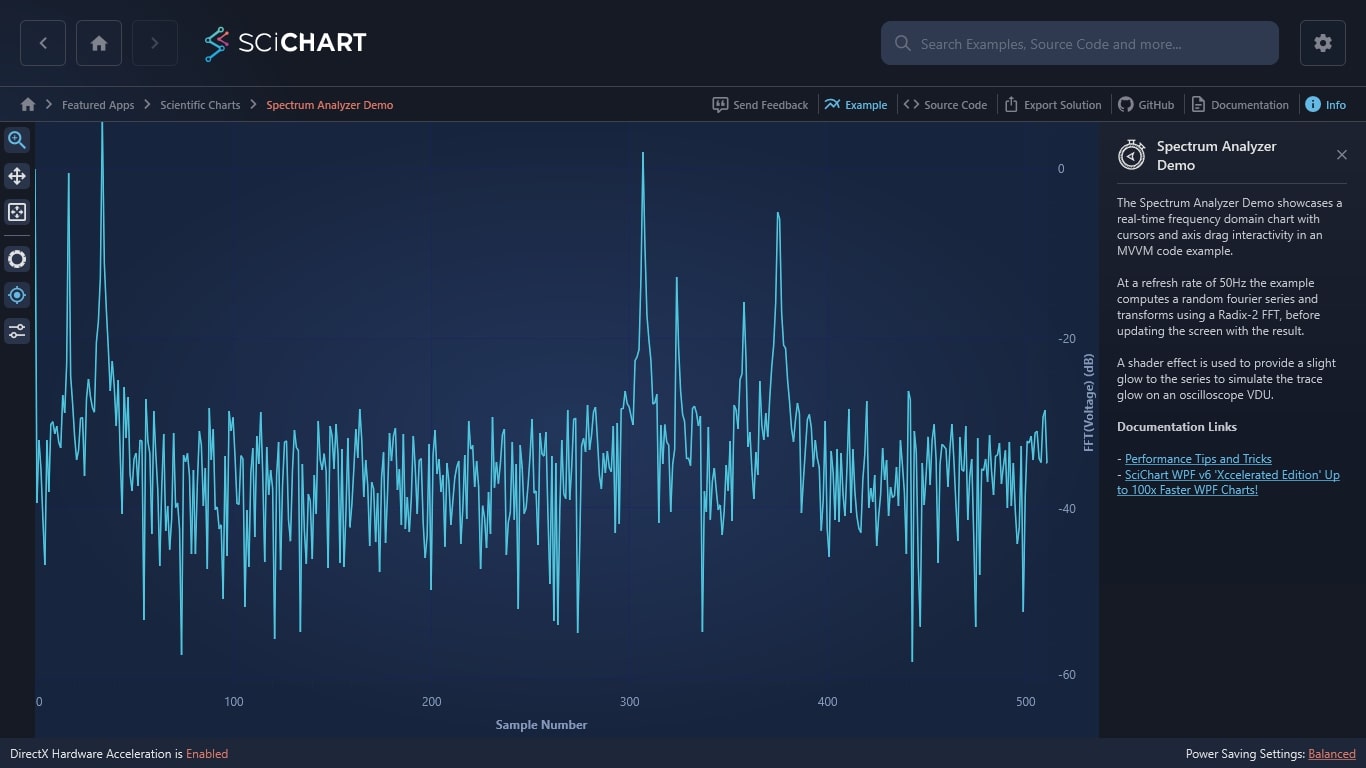
- High-frequency Data Processing: Secondary sampling techniques and Fast Fourier Transform (FFT) calculations allowed for real-time visualization and analysis of high-frequency data, ensuring accurate representation in both time and frequency domains.
- Post-Flight Analysis: The software facilitated detailed post-flight analysis by allowing engineers to replay flight data and study trends. This significantly reduced the time required to generate flight test reports, leading to faster decision-making and improved overall efficiency.
- Customizable Solutions: SciChart’s flexible API enabled engineers to customize data visualization and develop unique charting solutions for specific test environments. This adaptability was particularly beneficial in handling unique datasets, such as those generated during wind tunnel simulations.
The Outcome: Enhanced Aircraft Development and Certification Timelines
By automating complex data operations, SciChart significantly improved the ability to process and visualize large volumes of complex flight test data—even across different sampling rates. The flexible charting options, including multi-axis and high-frequency charts, enabled better insight into flight test performance and enhanced decision-making. With the ability to fully customize, rather than just using out-of-the-box solutions, engineers were able to adapt to each flight test while also ensuring scalability for future projects.
Thanks to the ability to render millions of data points with JavaScript and billions with WPF, engineers could make faster and more informed decisions during tests by continuously and accurately monitoring critical metrics in real-time. Powered by our award winning rendering engine, level of detail algorithms, resampling and data pre-processing were leveraged to ensure a smooth UI and retain userbility whilst interacting with terabytes of data.
SciChart reduced computational load, memory efficiency, and human interactivity, improving software performance and real-world usage.
These enhancements led to faster, more efficient flight test programs, ultimately benefiting aircraft development and certification timelines. The software met and exceeded the needs of the Chinese Government.
For more details on SciChart’s contribution to flight test data processing, you can explore the source here: Research on Quasi-real-time Flight Test Data Identification Method and Software Development.
