
Customer: Naval Air Systems Command (NAVAIR) and Maritime Surveillance Associates
Industry: Aerospace and Defense
Platform: SciChart JavaScript (React)
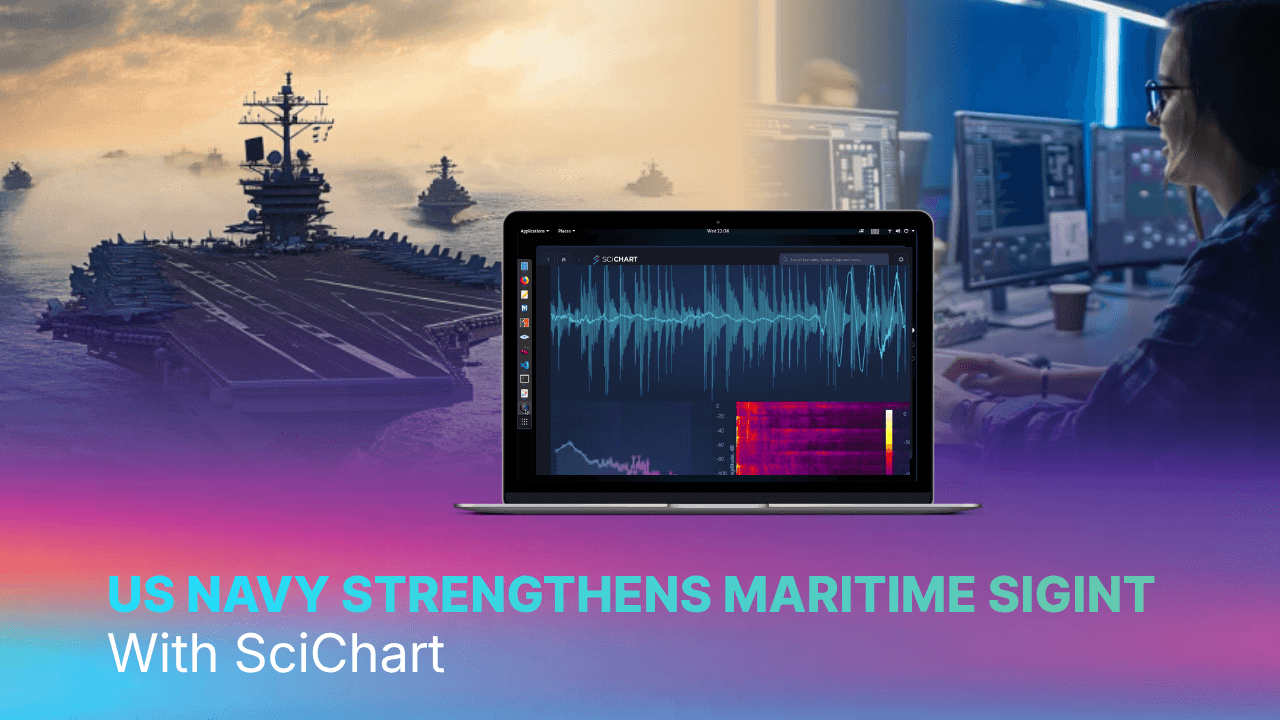
Under task orders valued at more than $7 million, NAVAIR and Maritime Surveillance Associates wanted to enhance the Global Reconstruction Analysis and Measurement System (GRAMS). This is a platform certified by the Office of Naval Intelligence (ONI). At the center of the upgrade is a cloud-based visualization layer built with SciChart’s React charts, giving analysts a faster, more accessible way to interpret acoustic and signals intelligence (SIGINT) data collected during anti-submarine warfare missions.
What Is GRAMS?
GRAMS forms part of the Multistatic Active Coherent Enhancements (MAC-E) Post Flight Analysis (PFA) Suite, which supports the Navy’s P-8A Poseidon maritime patrol aircraft. Analysts use the platform to detect and track submarines, surface ships, and weapons by interpreting underwater acoustic data collected during flight operations.
The MAC system is a tool for wide-area acoustic search, and GRAMS gives operators the analysis dashboards needed to turn that raw acoustic signal into a clear operational picture.
The Challenge: Real-Time Analysis at Scale
Anti-submarine warfare missions generate large volumes of acoustic data that need to be reviewed with precision, often under time pressure. NAVAIR and Maritime Surveillance Associates needed a visualization layer that could:
- Render Sound Pressure Level (SPL) data accurately enough for operators to make confident calls on submarine and surface ship activity.
- Move GRAMS into a web-based, cloud-hosted environment so SIGINT data could be reviewed remotely, rather than just from a fixed workstation.
- Support a Tactical Situation Display (TSD) that integrates with the P-8A Acoustic Operational Flight Product (AOFP) and can stand in for the Tactical Open Mission System (TOMS).
- Handle datasets large enough for wide-area acoustic search without losing rendering accuracy or speed.
The roadmap spans lab testing, TACMOBILE integration for the Tactical Mobile Acoustic Sensor Systems (TACMASS), and training center deployment. That meant that the chosen charting technology needed to behave consistently across multiple environments.
Why Did NAVAIR Choose SciChart React Charts
Maritime Surveillance Associates selected SciChart’s Visual Xccelerator™ rendering engine to power GRAMS, citing it as the only high-performance, precision rendering solution able to meet the program’s requirements. Built on SciChart’s JavaScript and React chart library, the new interface gave operators real-time graphical views of SPL data as it was captured and processed.
SciChart’s cross-platform library meant the team could standardize on a single rendering engine across GRAMS, the TSD, and future components. This would save time and hassle compared with maintaining separate charting solutions per platform.
For JavaScript and React implementations, SciChart supports rendering up to 1 billion data points per dataset. This matters for a platform processing continuous acoustic streams across multiple sensors and missions.
How the Technology Was Deployed
The Tactical Situation Display built on SciChart was rolled out across three settings:
- Lab environments, for thorough system testing before wider deployment.
- TACMOBILE, integrating the display into the Tactical Mobile Acoustic Sensor Systems.
- Training centers, helping naval crews build operational readiness on the same interface they will use in the field.
This work also supports the Navy’s HARBINGER SIGINT initiative, which is focused on collecting, processing, and analyzing signals intelligence in real time across maritime environments.
The Results: Faster, More Accurate Post-Mission Analysis
With SciChart’s React charts embedded in GRAMS, NAVAIR and the wider naval community gain a visualization layer they can rely on for maritime surveillance:
- Faster, more accurate post-mission analysis of acoustic and SIGINT data.
- Improved real-time tactical situational awareness through the Tactical Situation Display.
- A consistent training and simulation environment that mirrors the operational display.
- A cloud-based, web-accessible platform that supports remote analysis, rather than tying review to a single workstation.
What SciChart Offers Aerospace and Defense Teams
The GRAMS deployment reflects the same capabilities SciChart brings to other defense and aerospace projects, from signals intelligence to telemetry:
- Battle-Tested, Secure by Design: SciChart is trusted globally by NATO partners for mission-critical visualization. It runs fully offline with zero telemetry, deployable in any secure or air-gapped environment.
- Procurement-Ready, Source Available: Built for government and defense procurement standards. Source code access and licensing support long-term compliance, security audits, and sovereign control requirements.
- Proven Defense Industry Experience: SciChart has delivered directly to defense primes, consortiums, and military end users. This track record reduces integration risk for new programs.
- Real-Time Performance: SciChart’s React charts render high-frequency acoustic and sensor data, supporting up to 1 billion data points per dataset.
- Visual Xccelerator™ Rendering: A rendering engine built for the precision and processing power that mission-critical dashboards require.
- Cross-Platform Flexibility: One charting library across React, Angular, TypeScript, WPF, iOS, Android, and Linux, reducing the need to maintain separate visualization stacks per platform.
- Advanced Customization: An extensive API for building purpose-built dashboards, such as tactical situation displays and SPL analysis views.
- Technical Support: Access to human developers alongside an integrated AI assistant, useful for teams working to defense-grade timelines.
SciChart’s JavaScript library is also available under a free community license, giving development teams a way to evaluate the technology before committing to a full deployment.
Build Your Next Defense Dashboard
Whether the requirement is SIGINT software or a wider surveillance dashboard platform, the right visualization layer supports efforts to build a clearer operational picture when handling complex signal data.
Explore SciChart’s React charts to see how the same high-performance rendering engine behind GRAMS could support your next Aerospace and Defense project.



