Pre loader
Try wave

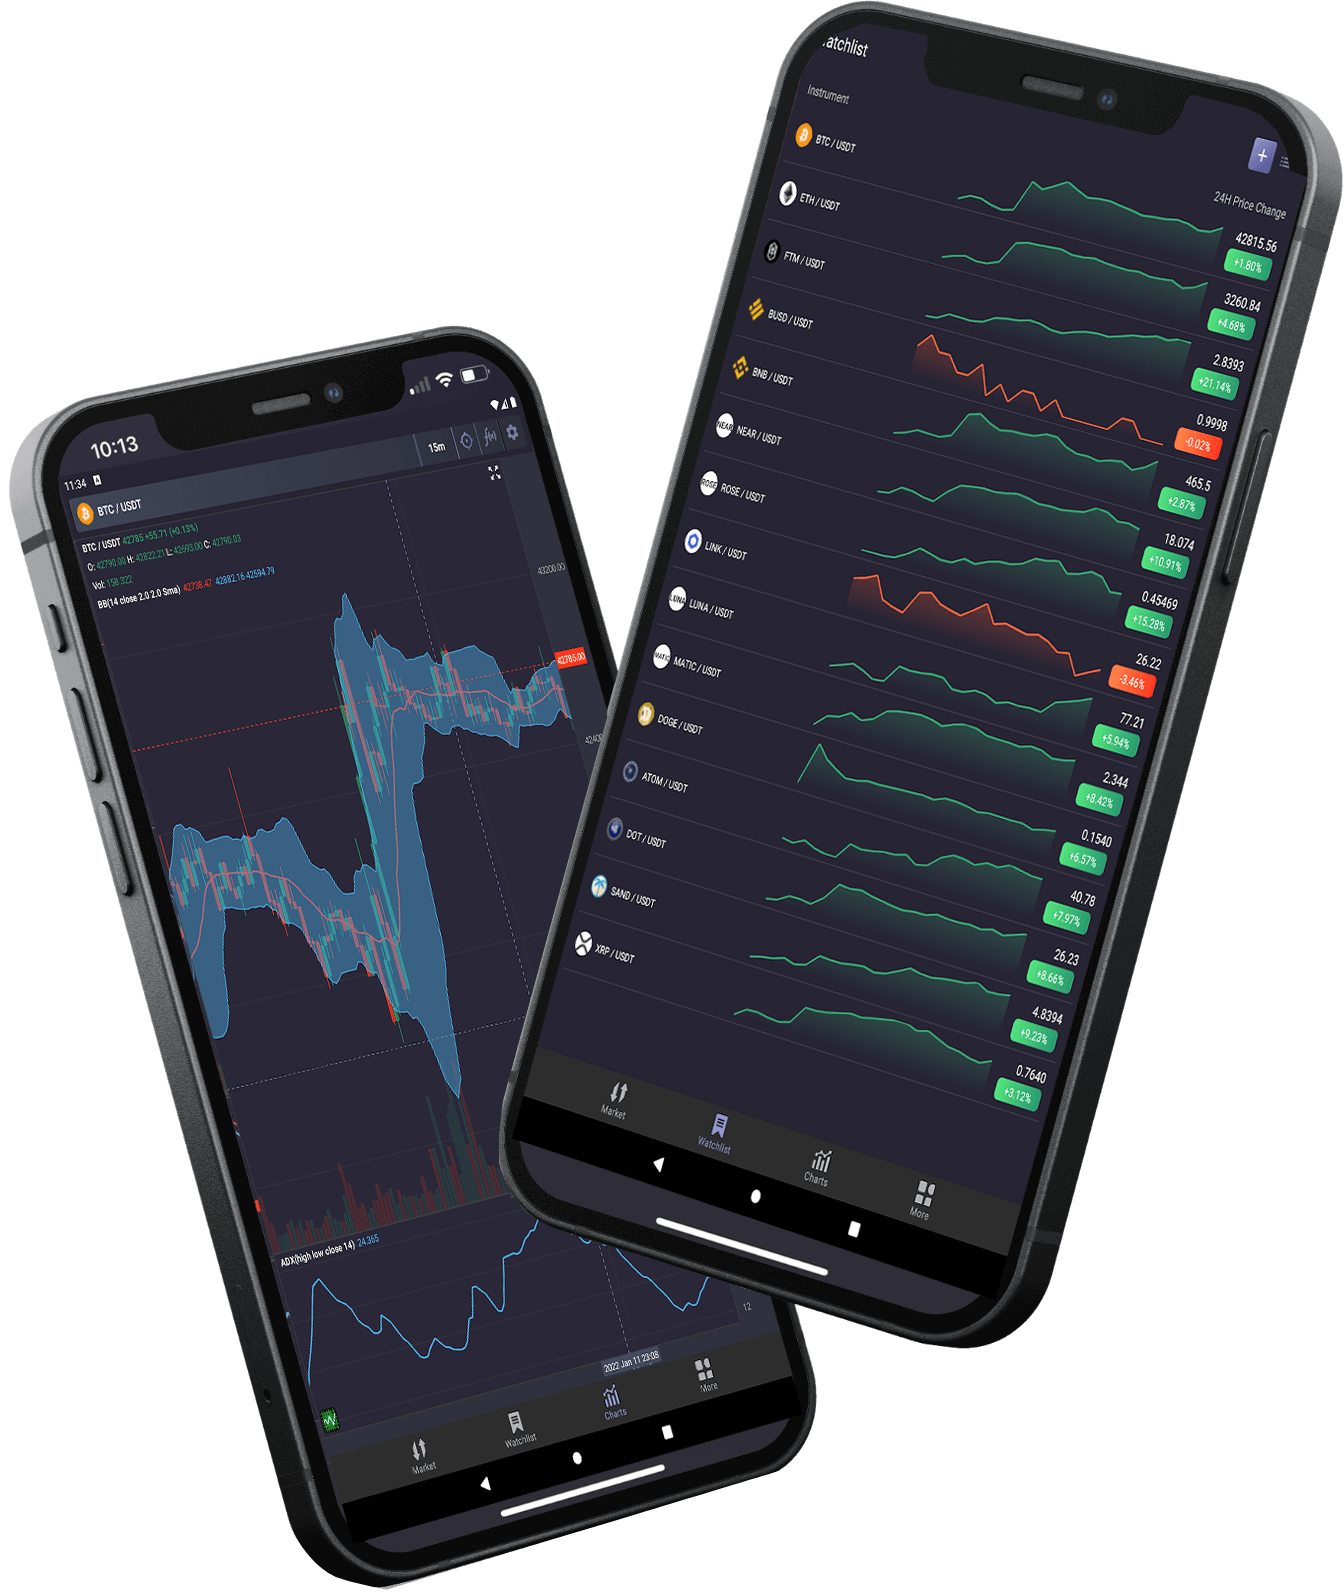
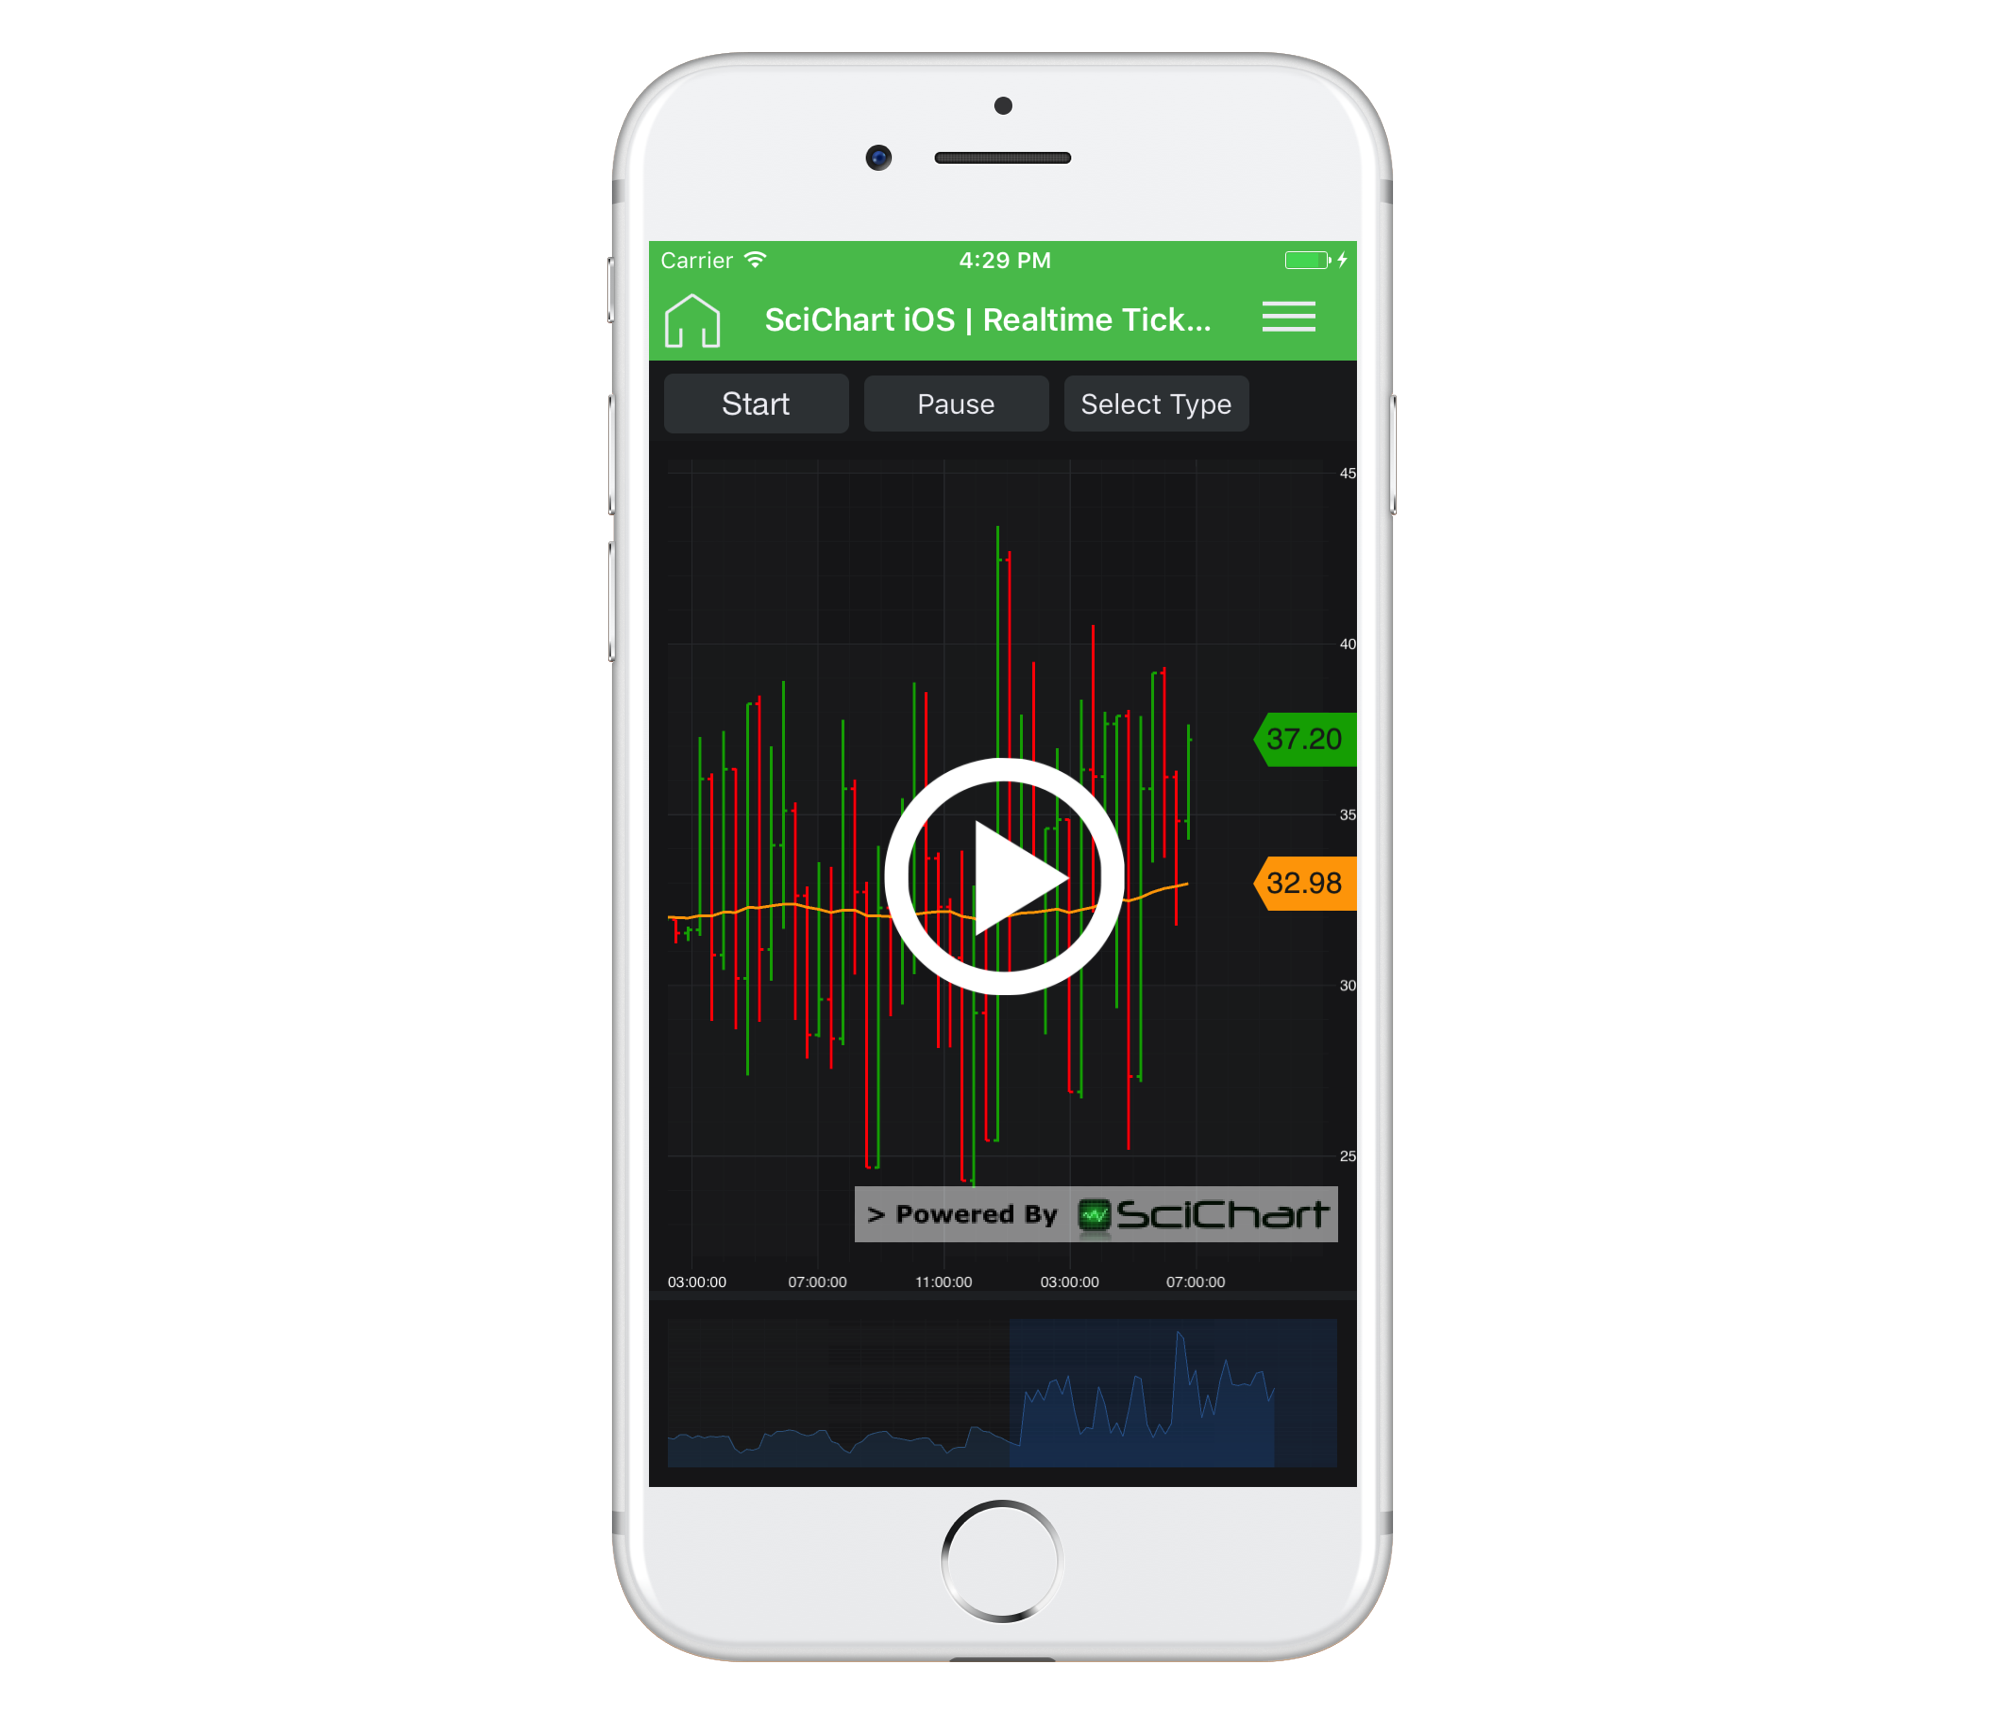
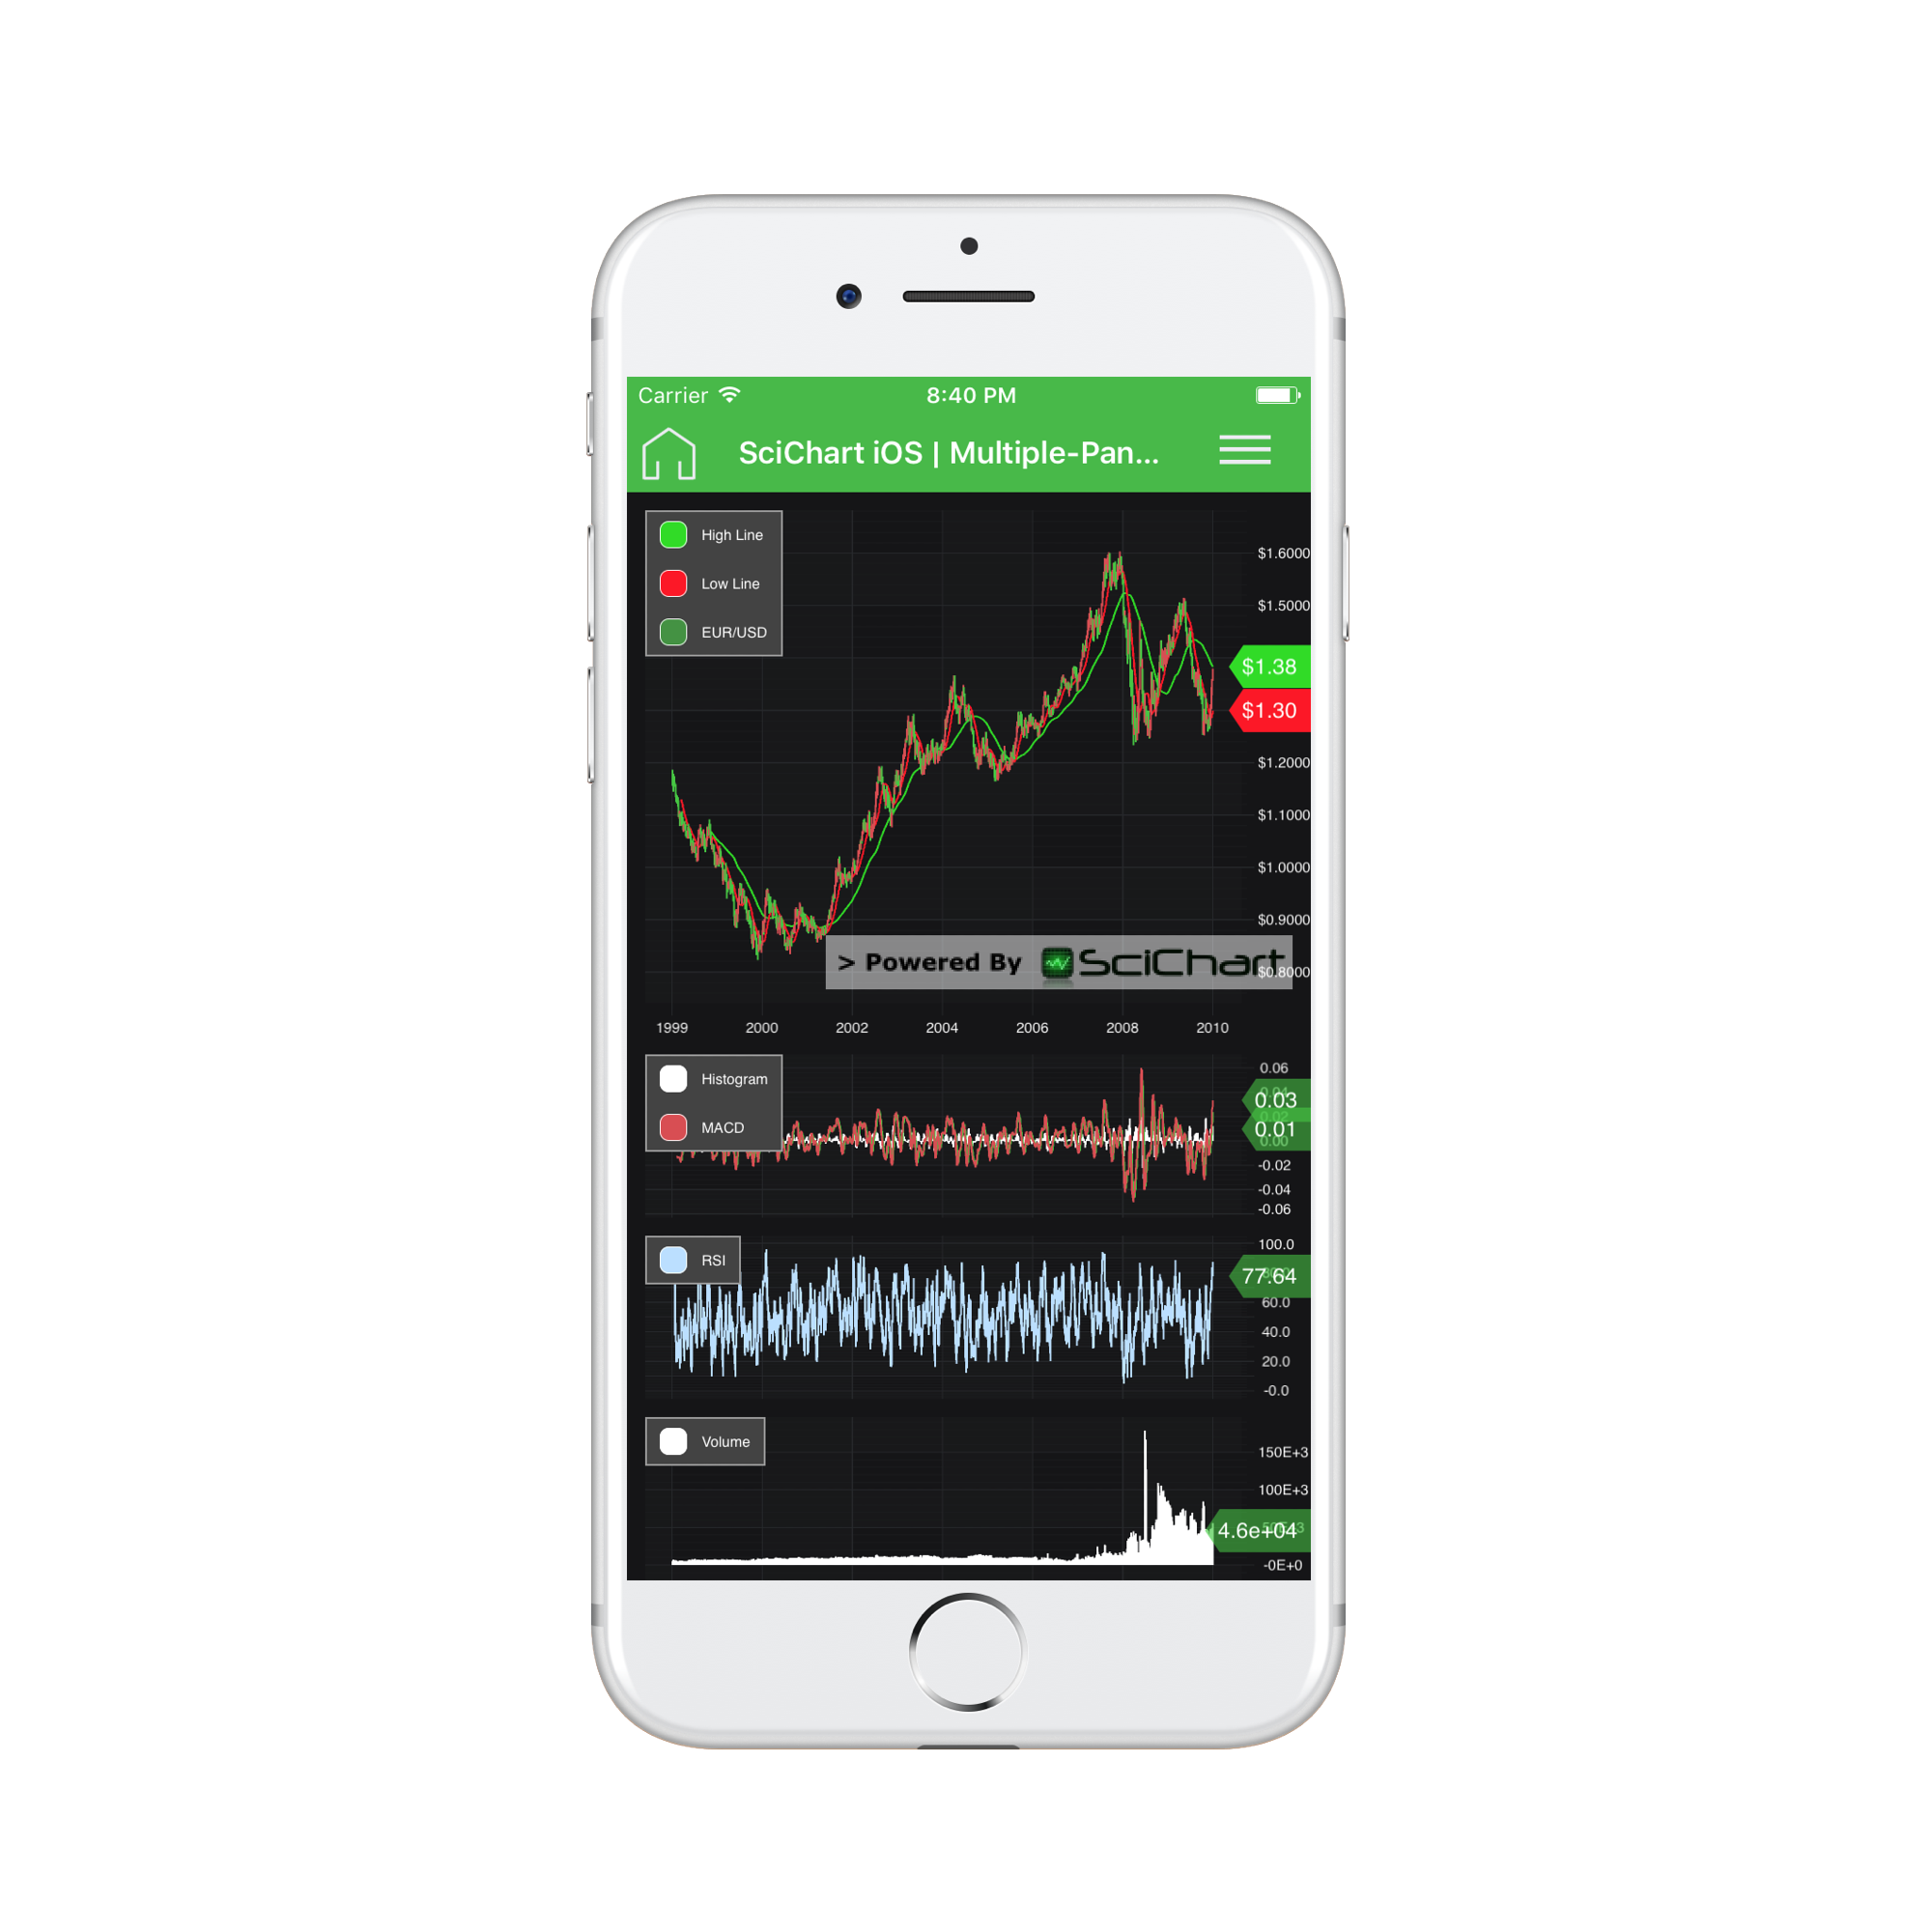
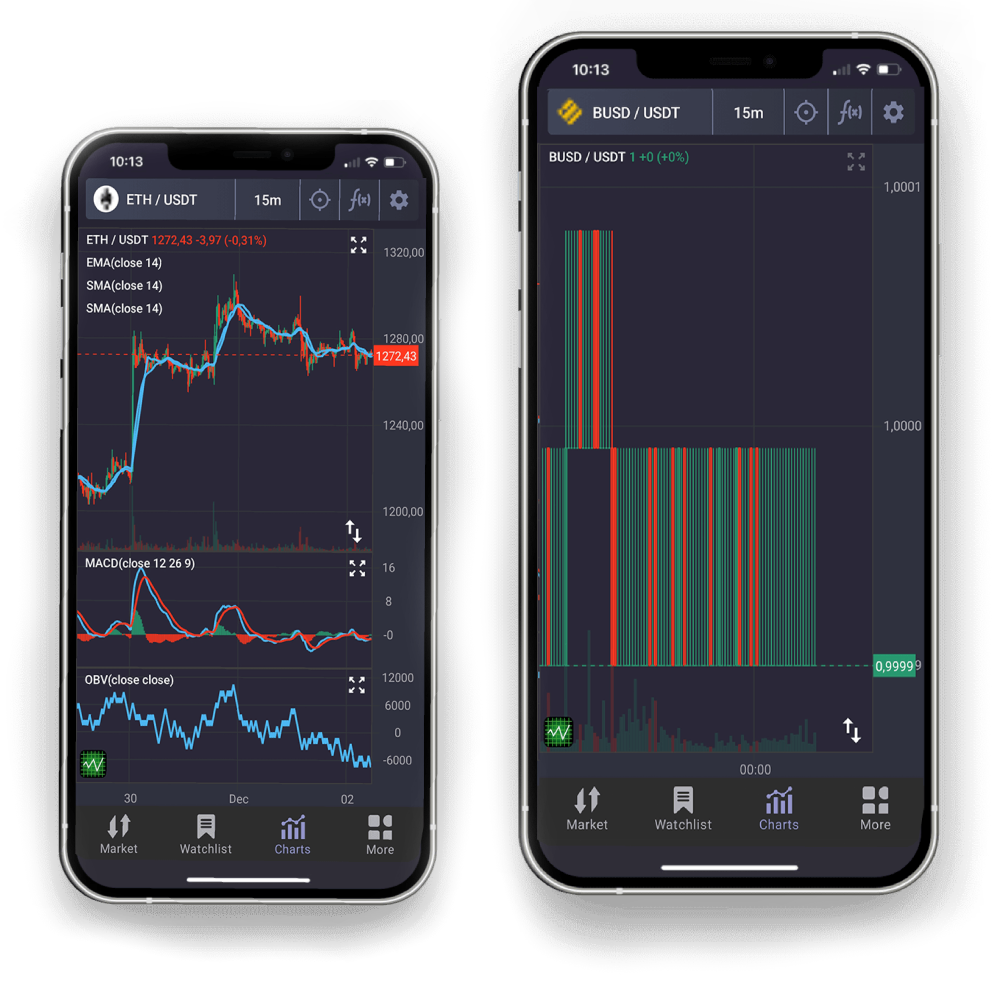
iOS Stock Chart Library

SciChart iOS is a High Performance, Real-time Chart Library for iOS developers. If you need a Fast, Powerful, feature-rich and interactive iOS Stock Chart in your Objective-C or Swift or Xamarin App then look no further than SciChart iOS.

Download Free Trial View Chart Pricing

Banner Image

iOS Stock Chart Features

SciChart iOS supports Candlestick, OHLC, Mountain/AreaColumnLineScatter charts out of the box. You can synchronize multiple charts, display price values on the Y-Axis, overlay buy/sell annotations and add your own custom indicators as our charts support multiple series of different types on the same chart surface. You can override the color of any column or candle with our PaletteProvider API, you can add optional tooltips and legends and even customizing rendering by making your own custom chart series. Our iOS Charts are flexible and feature rich, with rich touch pan and zoom interactivity for use in trading applications on the iPhone and iPad, whether you are working with Swift, Objective-C or Xamarin.

quote
star
star
star
star
star
Why build trading applications for iPad/iPhone? Fidelity Investments, which has nearly 15 million retail brokerage customer accounts, says that in 2013, mobile trading, including trading from tablets, grew 63% over the previous year. according to marketwatch.com*

Marketwatch.com

Need performance in your trading application?

Our iOS Stock Charts are fast to start up, fast at drawing and at updates. In conducted Performance Tests SciChart iOS is on average 12x faster than the nearest competitor and is consistently faster and smoother in real-time trading applications than other iOS Chart Components. By working alongside seasoned traders, we aim to bring you a truly high-performance, interactive experience for your iOS trading applications. We understand that hundreds of data points may be sent every minute and as such performance is critical and has dramatic impact on profitability in a trading applcation. SciChart iOS is shown to perform the best in a real-time context. Our stock charts really shine, because we understand that you want your users to be able to concentrate on trading, and not worry about hangs or performance issues in the charting software. Good performance is supported with interactivity, friendly panning and zooming.

Need more customization?

Our iOS and Xamarin iOS Stock Charts enable you to create true Realtime, Multi-pane Stock Chart applications. With SciChart you can add or remove panes, with different chart types. indicator & volume panes, all of which update and synchronize as you change your data. SciChart supports annotations which may be overlaid on the chart, including Text, Line, Box, HorizontalLine, VerticalLine out of the box, as well as our CustomAnnotation type which allows you to draw any UIView over the chart at a predefined location. Charts are enriched with intuitive pan, zoom and tapping functionality for working with the data in efficient way.

quote
star
star
star
star
star
I would like to drop you a quick line to say thank you for a brilliant product in SciCharts, which has outperformed my initial expectations. The Charts are smooth, fast and very professional looking and give our product the polished feel we were looking for. Overall, I am very impressed with SciCharts and the work you and your team have been doing, you are head and shoulders above the competition! Steve Griffiths, user of SciChart WPF Stock Chart MT Predictor Ltd

Steve Griffiths

All this starting from $999 / Developer License

SciChart’s iOS Stock Charts are a part of SciChart iOS package. SciChart Charts are licensed on a perpetual, per-developer licensing model, with royalty free redistribution. You get access to the world’s fastest iOS Charts, starting from just $999 per developer license.

Building your Stock Chart Mobile App Developer FAQ

icon

Do you have Stock Charts for Android and Xamarin iOS, so I can share the logic through applications on all platforms?

Yes and yes! Please see our Android Stock Charts Page and Xamarin bindings page. With SciChart Xamarin you will be able to share the logic through all the platforms. Please take a look at the Xamaring examples as well.

icon

How do I add series to my chart

We have a simple, easy to follow tutorial showing how to add two chart series and some data to a SciChart iOS Chart.

Simply declare a RenderableSeries, and a DataSeries, and append some data, and SciChart does the rest!

icon

How do I insert price data into my trading application?

Once you have declared a RenderableSeries and a DataSeries as per our tutorial above, simply update the data, and the chart will update too.

icon

How do I add panes?

To create multi-pane stock charts, you simply declare multiple SCIChartSurfaces in your application and link them together. We have a tutorial showing how to synchronize two charts here We also have a great code example which shows how to create a multi-pane stock chart here

icon

How do I configure zoom and pan behavior?

SciChart allows you to configure zoom and pan interactions via the ChartModifier API .

If you want to add Pinch to Zoom, Drag an Axis to Zoom, or double-tap to zoom extents, just use one of our built-in modifiers. Or, if you need a custom interaction, you can even create custom ChartModifiers. To find out how to use them, please see our Tutorial on adding Zooming, Panning behavior

icon

How do I use annotations to create buy/sell indicators?

SciChart features a rich, customizable Annotation API which allows you to place text, lines, and custom markers on the chart.

You can find out how to use our Annotations API with our Tutorial – Adding Annotations

icon

How do I add realtime data to my chart

SciChart excels at realtime chart performance which is absolutely necessary for your iOS Trading applications.

You can view our code example on Realtime ticking stock charts here . This shows how to tick and update a Candlestick or OHLC chart in realtime.

If you want to go further in understanding this feature, we also have a tutoria on Realtime Updates to the chart. This can be found here

icon

How do I add a Tooltip to the chart

You guessed it:) we even have a tutorial and a code example for adding tooltips to the chart via our flexible ChartModifier API. Take a look here for tooltips and legends and here for rollover modifier.

icon

GREAT! HOW DO I BUY IT!?

Go to our store or contact sales ! We will be happy to assist.

Try SciChart Today

Start a trial and discover why we are the choice
of demanding developers worldwide

Start TrialCase Studies