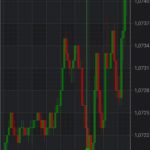
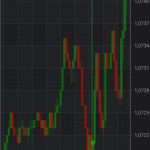
Hello, I was using version 4.2 before but I updated to version 4.4 last week. I am using candlestick chart in my project and show the chart in various time frames. These time periods include 1 day, 1 hour, 15 minutes, 1 minute and so on. Before the update to v4.4, when 1 time zone was selected, the example would show 09:00, 10:00, and on the 5 minute graph it would show as 09:00, 09:05, 09:10. After updating, it shows 09:00 instead of 09:05 when 5 minutes is selected, and 09:00 instead of 09:19 when 1 minute is selected. I want the date data that I added to the chart to be displayed as it is. I am also attaching screenshots for better understanding.
How can I fix this error I got? There is no problem with the data I have shown in the chart, it sounds as I want, but when I transfer it to the chart, it does not show as I want.
- devrim çatak asked 2 years ago
- You must login to post comments
Hi there.
I’m afraid that I don’t understand what the problem is. Your screenshots looks identical to me ( labels on xAxis ). Also you didn’t tell what axis type you use – CategoryDateAxis or DateAxis. Can you provide any code sample that reproduces the error, so I can run or test it ( modify one of our examples, create small test project)?
Thanks in advance.
- Yura Khariton answered 2 years ago
 Hi Yura, thank you for your reply. Before adding sample code below, I’ll try to better explain the problem I’m having. I am developing a finance application and the chart has time periods like 1 minute, 5 minutes, 10 minutes. For example, when I select a period of 10 minutes, I expect my data to be displayed in the tooltip as 10:00, 10:10, 10:20, 10:30. However, the times given in the tooltip that appears when I click on the screen after the update is wrong. It’s 10:00 instead of 10:10, 10:00 instead of 10:20, 10:00 instead of 10:30. This issue occurs in all minute periods such as 1 minute, 5 minutes, 10 minutes, 15 minutes, 30 minutes and 45 minutes. If you look at the screenshots I have attached to the question, it is seen that 2 different data are selected on the same graph, both should have different dates, but both are 09:00. whereas what should have happened was that one of them would appear as 09:10 and the other as 09:25. I hope I was able to explain my problem. I am attaching the sample code snippet. final CustomOhlcSeriesInfoProvider customModifier = new CustomOhlcSeriesInfoProvider(); customModifier.setSciChartFragmentUI(this); surface2 = view.findViewById(R.id.chartView); surface2.setOnTouchListener(this); runOnUiThread(new Runnable() { @Override public void run() { UpdateSuspender.using(surface2, new Runnable() { @Override public void run() { surface2.getRenderableSeries().removeAll(surface2.getRenderableSeries()); CategoryDateAxis xAxis2 = new CategoryDateAxis(getContext()); xAxis2.setVisibleRangeLimitMode(RangeClipMode.MinMax); FastCandlestickRenderableSeries candleSeries = sciChartBuilder.newCandlestickSeries() .withStrokeUp(0xFF00AA00) .withFillUpColor(0x8800AA00) .withStrokeDown(0xFFFF0000) .withFillDownColor(0x88FF0000) .withDataSeries(ohlcDataSeries) .withSeriesInfoProvider(customModifier) .build(); candleSeries.setDataPointWidth(SharedPreferencesHelper.getPreferences(“LineTickness”, 1)); Collections.addAll(surface2.getRenderableSeries(), candleSeries); } });
 OK, to sum it up – the problem is that tooltip showed by modifier on axis doesn’t match the value that is showed by axis labels. Is this correct? I’m going to take a look to see why this happens.
 Hi Yura, thank you again for your reply. I created a solution for this problem, I am sharing the solution below. After updating to v4.4, I need to add TextFormatting to make it look the way I want. The code I added; xAxis.setCursorTextFormatting(“yyyy MMM dd hh:mm”);
 Hi there. I found the cause of issue – there was an error in formatting string that we used by default ( there was ‘yyyy MMM dd HH:ss` instead of `yyyy MMM dd HH:mm` ). I fixed in our internal build and it will be published to our Maven repository later today.
 OK, fix should be in Maven – you can try it ( v4.4.0-nightly.4789 ). You can find instructions in our documentation ( fix is published into bleeding edge repository ) – https://www.scichart.com/documentation/android/latest/articles/UserManual/Integrating%20SciChart%20Libraries.html
- You must login to post comments
Please login first to submit.


