I want to display a line series chart with 3500 series. But the application hangs 20-30 seconds because SciChart is doing something in the UI thread. I’ve read your article “https://www.scichart.com/performance-improvements-scichart-wpf-v5-1/” and set the extension property s:PerformanceHelper.EnableExtremeDrawingManager=”True” and s:PerformanceHelper.EnableExtremeResamplers=”True”. But there is no improvement!
You can reproduce this issue using your example “WaterfallChartDemo” and increase the series count from 50 to 3500.
Why s:PerformanceHelper.EnableExtremeDrawingManager=”True” and s:PerformanceHelper.EnableExtremeResamplers=”True” has no effect?
- Tobias asked 5 years ago
- You must login to post comments
I am considering applying server-side licensing for my javerScript application.
In the document below, there is a phrase “Our server-side licensing component is written in C++.”
(https://support.scichart.com/index.php?/Knowledgebase/Article/View/17256/42/)
However, there is only asp.net sample code on the provided github.
(https://github.com/ABTSoftware/SciChart.JS.Examples/tree/master/Sandbox/demo-dotnet-server-licensing)
I wonder if there is a sample code implemented in C++ for server-side licensing.
Can you provide c++ sample code?
Also, are there any examples to run on Ubuntu?
- Tobias answered 5 years ago
 you may … be reaching the limit of what scichart (or any chart) can do. 3,500 series is a lot…. We are actively working now to do some pretty large performance improvements. I’ll look into this one as well as were doing the work.
 OK. However, they are the same data that I also display in a heatmap diagram. There are no problems. Of course, it’s a completely different way … Then I will wait for your further development.
- The strange thing is that the CPU in the UI thread is working at full capacity for 20-30 seconds. The GPU is almost not used at all. At the binding time, the RenderableSeries collection is already filled. The series will not be loaded one after the other into the chart. Are the chart modifier and legend separately initialized for each series or there are some inner bulk operations? By the way, I am testing with a ROC Zephurus with GeForce RTX 2080.
- You must login to post comments
Hi Tobias,
Thanks for your question.
Please follow the Performance Troubleshooting steps described on the following documentation page:
https://www.scichart.com/documentation/v5.x/webframe.html#Debugging%20Performance%20Problems.html
- Oleksandr Shvets answered 5 years ago
- You must login to post comments
Hi Oleksandr,
Thank you for your answer. I already did. Your solution to this problem is to set these two properties to true. But it did not help in my case and it did not help in your example “WaterfallChartDemo” if the serial number is changed to> 1000.
Any other idea?
- Tobias answered 5 years ago
- You must login to post comments
Hi Tobias,
By far the biggest thing you can do to improve performance is to enable DirectX. Have you done that? The Performance Tips & Tricks documentation has more info.
We’re doing a lot of work now on performance enhancements. One of our test that we’ve carried out is 1k series * 1k points, and also 10k series * 1k points. You can see the early test results of our enhancements at twitter.com/scichart.
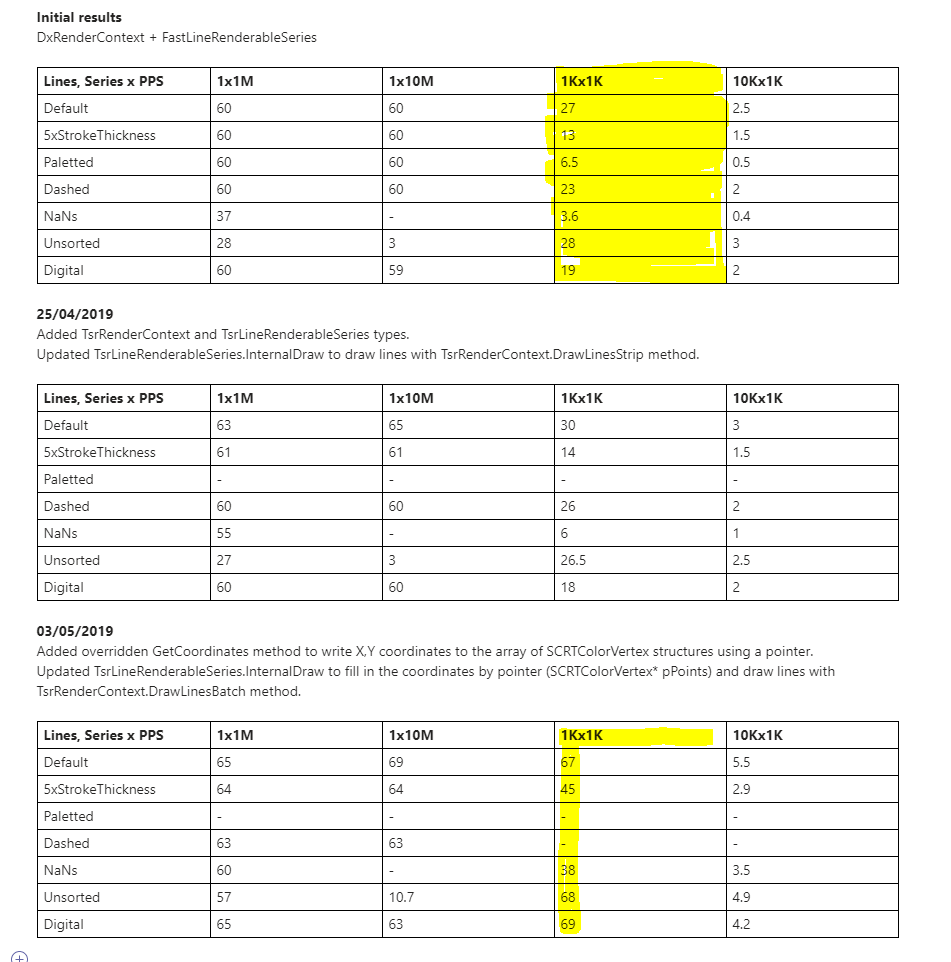
As you can see on this test run, 1k series x 1k points draws at 27 FPS. In the performance enhanced version it runs at 67 FPS (2x faster). However, 10k series runs at only 2.5 FPS – and 5.5 FPS. This is because the overhead of so many series is going to slow the chart down no matter what you do.
Finally, we have a performance test suite published over here at Github. You can run this on your computer and one of the performance tests loads a chart with 1,000 series x 1,000 points. You can learn more about this test suite at the article WPF Chart Performance Enhancements.
Best regards,
Andrew
- Andrew Burnett-Thompson answered 5 years ago
- You must login to post comments
Please login first to submit.
