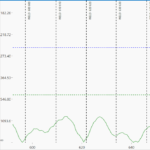
I need to update a lot of annotations. Not so much. Remove and add about 10-100 annotations per action. And it takes a lot of time. I’ve already tried all the recommendations with SusppendUpdates etc, but the result is the same.
I don’t need the flexibility of UIElements. I’m using it as markers only.
So, maybe it is possible to implement annotations as a series with a custom point marker. I need a vertical dashed line with text, like in screenshot. Is there a way to do it?
- You must login to post comments
Thanks for the replies. My current solution to this problem is not nice, but effective. The most time-consuming operation is removing of annotation. Instead of removing I just change the annotations out of visible range and add a new one if it is required. Changing the annotation parameters doesn’t cost any time.
It allows me to get instant fast scrolling almost without brakes.
- Alexander Erkabaev answered 5 years ago
- You must login to post comments
Hi Alexander,
Thanks for your question.
You are right, Annotations are as slow as other WPF UIElements.
I would suggest creating your own RenderableSeries type instead. It allows drawing on a chart using the RenderContext API:
https://www.scichart.com/documentation/v5.x/webframe.html#The%20Immediate%20Mode%20RenderContext%20API.html
Also please find an article about CustomRenderableSeries here:
1https://www.scichart.com/documentation/v5.x/webframe.html#Custom%20Series%20(CustomRenderableSeries).html
Please let me know if you have any questions.
- Oleksandr Shvets answered 5 years ago
- last edited 5 years ago
- You must login to post comments
Sounds like you do need the flexibility of UIElement Annotations: dashed lines, text on chart, placed at X values…
There is another way to draw on the screen much faster, but it will require more work. You would have to use our CustomRenderableSeries Api to create a custom series which draws the vertical lines & the text labels at the right place. Note it is not as flexible as the Annotations API.
For documentation on the Custom Series API, see here.
Our team can also create custom series as part of short-term consultancy projects. If this is of interest to you, let me know.
Best regards,
Andrew
- Andrew Burnett-Thompson answered 5 years ago
- You must login to post comments
Please login first to submit.

