Hello everyone, so right now with current V3 iOS-Swift version (‘SciChart’, ‘3.1.0-nightly.5287’)
what is the solution for avoiding gabs and empty line areas during weekends or other period that the dataSeries has no values ?
- Dxat answered 4 years ago
Hi Uwe,
This has been asked a few times before. What DataSeries.SuspendUpdates does is it locks the parent surface SyncRoot object ensuring that Render Operations cannot be processed while the DataSeries is being updated e.g.
var ds0 = new XyDataSeries<double,double>();
var ds1 = new XyDataSeries<double,double>();

// can suspend one dataseries, which locks the parent surface
using (ds0.SuspendUpdates())
{
     // Can append many dataseries
     ds0.Append(..., ...);
     ds1.Append(..., ...);
}
// parent surface redraws
DataSeries.SuspendUpdates() doesn’t behave exactly the same as SciChartSurface.SuspendUpdates(), but it does synchonize the DataSeries and SciChartSurface preventing re-draw inside the suspend updates block.
Let me know if this works in your situation.
Best regards,
Andrew
- Andrew Burnett-Thompson answered 9 years ago
thanks, andrew.
I am sure it is the latest release of SciChart WPF V6.3. The special usage is to use multiple UI threads. However, when i test it in a new project,i can’t reproduce the issue. About code, i use the scichart in the most common way, each window has a timer to update the dataseries by dispatcher. Is it restricted to use on Multiple UI threads.
- YXJ YXJ answered 3 years ago
Hi Quyen
This topic is covered in the updated documentation which has been improved in the SciChart.js v3.1 release. There is a working embedded code sample in the above page which has a dynamically updated heatmap.
To update the heatmap values, you can updated part, or all of the zValues array e.g.
// Create an empty 2D array of size height & width
const initialZValues = zeroArray2D([height, width]);
// Create a Heatmap Data-series. Pass the heatValues as a number[][] to the UniformHeatmapDataSeries
const heatmapDataSeries = new UniformHeatmapDataSeries(wasmContext, {
    xStart: 100,
    xStep: 1,
    yStart: 100,
    yStep: 1,
    zValues: initialZValues
});
// ...
// Later, update the data
initialZValues[5][6] = 123.4;
// Tell SciChart the data has changed
heatmapDataSeries.notifyDataChanged();

// You can also load an entirely new array with the function UniformHeatmapDataSeries.setZValues
const newZValues // type number[][]
heatmapDataSeries.setZValues(newZValues);
However, changing the size, or XStep, XStart, YStep, YStart are not supported.
This workaround can also be applied to your use-case.
The UniformHeatmapDataSeries doesn’t have a way to modify or change the xStart, xStep, yStart, yStep properties after construction. However, the heatmap simply wraps a 2d array so the overhead to create a new UniformHeatmapDataSeries and assign it to the RenderableSeries is quite low.
I suggest simply calling the constructor on heatmap dataseries passing in your new updated size zValues and assign to UniformHeatmapRenderableSeries.dataSeries property
const zValues: number[][] = ...

const heatmapData = new UniformHeatmapDataSeries(webAssemblyContext, {
    xStart: 0,
    xStep: 1,
    yStart: 0,
    yStep: 1,
    zValues
});

const heatmapRenderSeries = new UniformHeatmapRenderableSeries(webAssemblyContext, { dataSeries: heatmapData });

// Later, you want to update either xStart, xStep, yStart, yStep or resize zValues you can do this
heatmapRenderSeries.dataSeries = new UniformHeatmapDataSeries(webAssemblyContext, {
    xStart: 100,
    xStep: 1,
    yStart: 100,
    yStep: 1,
    zValues
});
Read the forum question for more details.
- Andrew Burnett-Thompson answered 1 year ago
- last active 1 year ago
UPDATE: SciChart v4 Now Supports PointMetadata Natively
You will be pleased to know, in SciChart v4 we have included the new PointMetadata API natively.
This allows you to tag any data-point with a class of your choice (implementing IPointMetadata interface) and pass through to tooltips and hit-test.
Demo
There is a full example in our SciChart v4 WPF Examples Suite -> Tooltips and Hit Test -> Series with Metadata
Example
// Create the IPointMetadata derived type
public class MyMetadata : IPointMetadata
{
   public event PropertyChangedEventHandler PropertyChanged;

   public MyMetadata(string label)
   {
      this.Label = label;
   }

   public bool IsSelected { get; set; }
   public string Label { get; set; }
}

// Append it to DataSeries
void Foo()
{
   var xyDataSeries = new XyDataSeries<double>();
   xyDataSeries.Append(0, 10, new MyMetadata("Hello"));
   xyDataSeries.Append(1, 20, null);
   xyDataSeries.Append(2, 30, new MyMetadata("World!"));
}
Throughout SciChart v4 you can now bind to PointMetadata in tooltips, get PointMetadata in PaletteProviders and access via the DataSeries.Metadata column.
Best regards,
Andrew
- Andrew Burnett-Thompson answered 8 years ago
Hi Jørgen,
Thanks for your inquiry. I am sorry for the late reply.
Could you please also send us a small sample project reproducing the issue for investigation?
You can also submit this as a support ticket here:
https://support.scichart.com/index.php?/Tickets/Submit
Thanks in advance.
With best regards,
Oleksandr
- Oleksandr Shvets answered 3 years ago
- last active 3 years ago
I figured out my issue. I needed to set the AutoRange=”Always” on the XAxis.
- Doug Witt answered 6 years ago
Hi Neda,
Thanks for your inquiry.
Unfortunately, we have noticed your license support has expired.
If you wish to continue receiving technical support further please consider renewing your support subscription.
To do that please contact Sales here:
https://www.scichart.com/contact-us/
Or email us to [email protected]
With best regards,
- Oleksandr Shvets answered 4 years ago
Thank you for your reply Andrew.
I’m preparing a test project for you and I’ll send it via email.
Thanks
- lorenzo522 answered 8 years ago
Hi John,
Thanks for your inquiry and for the clarification. I am sorry for the late reply.
The Donut Chart and Pie Chart share the same base class as you can see on the following documentation page:
https://www.scichart.com/documentation/v5.x/webframe.html#The%20Donut%20Chart%20Type.html
So you should be able to create and configure SciChartDonutSurface similarly to SciChartPieSurface.
I have noticed we have no code for Pie Chart on our Examples page. We’ll fix this. Please find the corresponding code here:
https://github.com/ABTSoftware/SciChart.Wpf.Examples/tree/master/v5.x/Examples/SciChart.Examples/Examples/CreateGaugeCharts
You can also find the Pie Chart and Donut Chart examples in our Examples suite.
Regarding animation – it is not supported currently. However, you can create a New feature request and let people vote for it. Here is how to do this:
https://www.youtube.com/watch?v=cWa6bRCCAFE
With best regards,
Oleksandr
- Oleksandr Shvets answered 4 years ago
I am considering applying server-side licensing for my javerScript application.
In the document below, there is a phrase “Our server-side licensing component is written in C++.”
(https://support.scichart.com/index.php?/Knowledgebase/Article/View/17256/42/)
However, there is only asp.net sample code on the provided github.
(https://github.com/ABTSoftware/SciChart.JS.Examples/tree/master/Sandbox/demo-dotnet-server-licensing)
I wonder if there is a sample code implemented in C++ for server-side licensing.
Can you provide c++ sample code?
Also, are there any examples to run on Ubuntu?
- Nathanael Anderson answered 4 years ago
Hi Alexander
Have you had a look at our Annotations API? It’s designed exactly for this. We also have an API that lets you draw Elliot Waves directly onto the chart, which may be more useful.
You can if you want, create a Custom Series. This will be more performant than annotations, but its a little bit harder and more work.
Either way we have plenty of examples at http://www.scichart.com/wpf-chart-examples
Let me know if this helps,
Best regards,
Andrew
- Andrew Burnett-Thompson answered 4 years ago
Hello Nathanael,
It shouldn’t be the case, at lease we don’t know about that. We are publishing our examples app to the App Store, and it doesn’t use mentioned property, you can see it from our repo here – https://github.com/ABTSoftware/SciChart.iOS.Examples.
Linking AppStore link for reference here as well – https://apps.apple.com/us/app/scichart-examples/id1485200499?ls=1
I don’t think I can be more of help here. But if you will find anything we can help you with – feel free to contact us.
Best Regards,
Nazar Rudnyk
Lead SciChart iOS Developer
// SciChart News
// SciChart has won the Queens Award For Enterprise in the Innovation category! – https://www.scichart.com/queens-award-innovation
// SciChart receives Highly Commended in National Business Awards! – https://www.scichart.com/lloyds-innovation-award
// SciChart Mobile SDK v3 / WPF SDK v6 released! – https://www.scichart.com/scichart-mobile-sdk-v3-0-0-released
// Over 320 SciChart Reviews! – https://www.reviews.co.uk/company-reviews/store/scichart-com
- Nazar Rudnyk answered 4 years ago
Hi Stuart,
I’ve just tried this today and I didn’t get a crash. What I did was I removed the lower chart in our Sync Multi Chart mouse example. The top chart still has a MouseEventGroup set. I am using our latest v3.3.x release.
What version are you using? Are you able to send over a code sample that reproduces the issue to support.scichart.com?
Best regards,
Andrew
- Andrew Burnett-Thompson answered 9 years ago
I found problem… i am use old version of this hack https://github.com/facebook/react-native/issues/17968
like:
for (int i = 0; i < getChildCount(); i++) {
View child = getChildAt(i);
child.measure(MeasureSpec.makeMeasureSpec(getMeasuredWidth(), MeasureSpec.EXACTLY),
MeasureSpec.makeMeasureSpec(getMeasuredHeight(), MeasureSpec.EXACTLY));
child.layout(0, 0, child.getMeasuredWidth(), child.getMeasuredHeight());
}
and its move annotation surface to point 0, 0
now i use
private void refreshViewChildrenLayout(View view){
view.measure(
View.MeasureSpec.makeMeasureSpec(view.getMeasuredWidth(), View.MeasureSpec.EXACTLY),
View.MeasureSpec.makeMeasureSpec(view.getMeasuredHeight(), View.MeasureSpec.EXACTLY));
view.layout(view.getLeft(), view.getTop(), view.getRight(), view.getBottom());
}
and annotation render correctly!!
- Sergey Evdokimov answered 1 year ago
Was going to say the same thing as Yuriy, but a little more detail.
When you have five million points, often several datapoints get drawn to the same pixel (called overdraw). We detect this and reduce the number of points at draw time to improve performance.
When you use PaletteProvider you’re operating on this reduced set. This is probably why you setting colors means not all points appear coloured in.
ResamplingMode.None May help you here but it will also make performance really bad.
I’d actually like a code sample of what you have here to reproduce it on our side. I think our new rendering engine in scichart WPF v6 , which has gradient shading between points, may help.
Can you send a code sample over to support (at) scichart .com?
- Andrew Burnett-Thompson answered 5 years ago
Hi Linnea
That’s great you solve the issue. Can you share your code so that it can help other users too?
Thanks
- Bikrant Srivastwa answered 1 year ago
- last active 1 year ago
Hi Niu mag,
Your support subscription expired in June 2021, however you should be able to use version(s) of SciChart which were released before then. Unfortunately we haven’t tested out and don’t support side-by-side licensing of different SciChart versions.
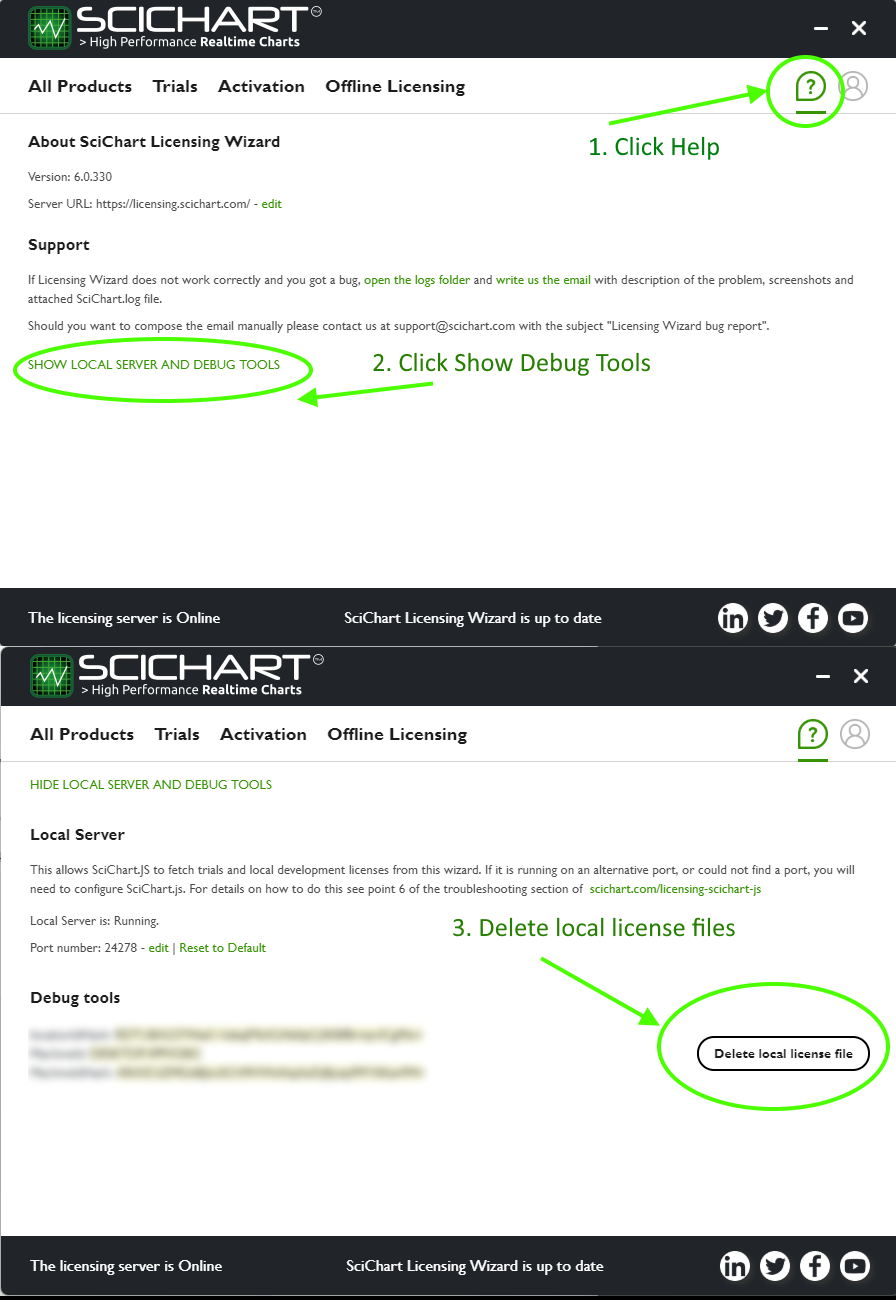
You can delete all the licensing info on your computer in the licensing wizard by going to here. This will reset your computer to the default status (no license) and you can try again.
We would suggest using one license at a time, for example, Trial or Activated v6.2. Not both as that won’t work.
If you would like to renew your support subscription so that our team can assist you with tech support, please contact sales
Best regards,
Andrew
- Andrew Burnett-Thompson answered 2 years ago
Hi Andrew,
Looking at the WPF Chart documentation I see you can see the following:
<s:ModifierGroup>
         <s:LegendModifier ShowLegend="True" Orientation="Horizontal" Margin="10"
                           LegendPlacement="Inside" GetLegendDataFor="AllSeries"
                       ShowVisibilityCheckboxes="True"/>
 </s:ModifierGroup>
What I want is the LegendPlacement to be outside. First, should it be set LegendPlacement=”Outside”. Second, in my copy of Sci-Chart I do not have this property? What can I do instead? Thank you.
- Samir Shah answered 8 years ago
- last active 8 years ago
I am considering applying server-side licensing for my javerScript application.
In the document below, there is a phrase “Our server-side licensing component is written in C++.”
(https://support.scichart.com/index.php?/Knowledgebase/Article/View/17256/42/)
However, there is only asp.net sample code on the provided github.
(https://github.com/ABTSoftware/SciChart.JS.Examples/tree/master/Sandbox/demo-dotnet-server-licensing)
I wonder if there is a sample code implemented in C++ for server-side licensing.
Can you provide c++ sample code?
Also, are there any examples to run on Ubuntu?
- Flemming Rosenbrandt answered 9 months ago
