Hi, guys
I want to show two renderableSeries on one chart view. These series have common x-axis (SCICategoryDateTimeAxis) and separate y-axes(SCINumericAxis). Only one of y-axis is visible at chart view. Also the data series of visible renderable series updated by scrolling to left or to right. So for displaying on one view i’m using:
[y1Axis setGrowBy: [[SCIDoubleRange alloc] initWithMin:SCIGeneric(0.3) Max:SCIGeneric(0.07)]];
[y2Axis setGrowBy: [[SCIDoubleRange alloc] initWithMin:SCIGeneric(0.0) Max:SCIGeneric(5)]];
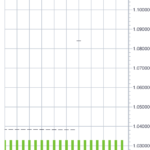
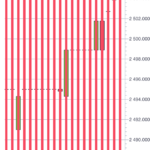
So it’s look good at start (Correct_zooming.png). But after some scrolling it decrease axis extents of invisible y-axis (decrease.png).
Or even breaks down (broken.png)
For test i’m using SCIFastOhlcRenderableSeries and SCIHorizontallyStackedColumnsCollection readerable series.
Data series for SCIHorizontallyStackedColumnsCollection is initializated like:
    [volumeSerie1 updateAt:index Y:SCIGeneric(100000 / [multiplier doubleValue])];
    [volumeSerie2 updateAt:index Y:SCIGeneric(500000 / [multiplier doubleValue])];
So can you look at it?
Or what way i should implement this behavior?
Best regards,
Sushynski Andrei
- Andrei Sushynski asked 7 years ago
- You must login to post comments
Hi, Andrei
I think the main problem is in set of data.
You set both y axis autoRange into SCIAutoRange_Always. And of course when you scroll by x axis, y axis range is changed too. Because on the x visible range max range for y axis is different.
so the second screenshot looks right.
What about third one – yeap it looks bad. I think for repeating the bug i need the set of data which you use.
Also Try not to use SCIHorizontallyStackedColumnsCollection – beacuse as i can see here it’s not needed. It’s enough for you here use SCIVerticallyStackedColumnsCollection. Your columns only are stacked vertically.
Just add vertical stacked group ([self.chartView.renderableSeries add:stackedGroup ];).
Best Regards, Mykola
- Mykola Hrybeniuk answered 7 years ago
- You must login to post comments
Hi, Andrei
Could you please give more code, for example code of configuration of y axes and renderable series.
I will try to help but i need more information. Maybe even small project with the issue. It would be the best variant.
Best Regards, Mykola
- Mykola Hrybeniuk answered 7 years ago
- You must login to post comments
More details
Axes:
axes style:
SCITextFormattingStyle *  textFormatting = [[SCITextFormattingStyle alloc] init];
[textFormatting setFontSize:14];
[textFormatting setFontName:@"Helvetica"];
[textFormatting setColor:[UIColor whiteColor]];

SCIAxisStyle * axisStyle = [[SCIAxisStyle alloc] init];

[axisStyle setMajorTickBrush:majorPen];
[axisStyle setGridBandBrush: gridBandPen];
[axisStyle setMajorGridLineBrush:majorPen];
[axisStyle setMinorTickBrush:minorPen];
[axisStyle setMinorGridLineBrush:minorPen];
[axisStyle setLabelStyle:textFormatting];
[axisStyle setDrawMinorGridLines:NO];       // visibility of grid
[axisStyle setDrawMajorGridLines:YES];       // visibility of dividing of grid
[axisStyle setDrawMajorBands:NO];            // visibility of chart area сross-hair
X axis
xAxis = [[SCICategoryDateTimeAxis alloc] init];
xAxis.axisId = kBaseChartAxisX;

[xAxis setStyle:axisStyle];

[self xAxisVisibleRangeChangeCallback];

[self.chartView.xAxes add:xAxis];
X axis callback
- (void)xAxisVisibleRangeChangeCallback
{
__block __weak typeof(self) welf = self;
[xAxis registerVisibleRangeChangedCallback:^(id<SCIRangeProtocol> newRange, id<SCIRangeProtocol> oldRange, BOOL isAnimated, id sender) {

    if (welf.dataManager.isSurfaceSynchronized) {

        if ([welf.delegate respondsToSelector:@selector(chartViewDidScrollToRange:fromRange:)]) {
            [welf.delegate chartViewDidScrollToRange:newRange fromRange:oldRange];
        }
    }
}];
}
Y axes
base Y axis
SCINumericAxis *yAxis = [[SCINumericAxis alloc] init];
yAxis.axisId = kBaseChartAxisY;

[yAxis setStyle:axisStyle];
[yAxis setNumberFormatter:[self.dataManager chartPriceFormatter]];
[yAxis setAutoRange:SCIAutoRange_Always];

[self.chartView.yAxes add:yAxis];
second Y axis
SCINumericAxis *yAxisVolume = [[SCINumericAxis alloc] init];
yAxisVolume.axisId = kBaseChartAxisVolumeY;
[yAxisVolume setStyle:axisStyle];
[yAxisVolume setAutoRange:SCIAutoRange_Always];
[yAxisVolume.style setDrawLabels:NO];
[yAxisVolume.style setDrawMajorTicks:NO];
[yAxisVolume.style setDrawMajorGridLines:NO];
[yAxisVolume.style setDrawMinorTicks:NO];

[self.chartView.yAxes add:yAxisVolume];
- Andrei Sushynski answered 7 years ago
- You must login to post comments
Base RenderableSeries
SCIRenderableSeriesBase *renderableSeries;      // displayed chart based on data series

renderableSeries = [[SCIFastCandlestickRenderableSeries alloc] init];
renderableSeries.xAxisId = kBaseChartAxisX;
renderableSeries.yAxisId = kBaseChartAxisY;
[renderableSeries setDataSeries:self.dataManager.chartBaseDataSeries];
Stacked RenderableSeries
SCIVerticallyStackedColumnsCollection *stackedGroup = [SCIVerticallyStackedColumnsCollection new];
stackedGroup.xAxisId = kBaseChartAxisX;
stackedGroup.yAxisId = kBaseChartAxisVolumeY;

SCIStackedColumnRenderableSeries *renderableSeriesAsk = [SCIStackedColumnRenderableSeries new];
renderableSeriesAsk.fillBrushStyle = [[SCISolidBrushStyle alloc] initWithColor:colorScheme.volumeAsk];
renderableSeriesAsk.strokeStyle = nil;
renderableSeriesAsk.style.dataPointWidth = 0.4;
renderableSeriesAsk.dataSeries = self.dataManager.dataSeries[kChartDataSerieVolumeAsk];
renderableSeriesAsk.xAxisId = kBaseChartAxisX;
renderableSeriesAsk.yAxisId = kBaseChartAxisVolumeY;

[stackedGroup add:renderableSeriesAsk];

SCIStackedColumnRenderableSeries *renderableSeriesBid = [SCIStackedColumnRenderableSeries new];
renderableSeriesBid.fillBrushStyle = [[SCISolidBrushStyle alloc] initWithColor:colorScheme.volumeBid];
renderableSeriesBid.strokeStyle = nil;
renderableSeriesBid.style.dataPointWidth = 0.4;
renderableSeriesBid.dataSeries = self.dataManager.dataSeries[kChartDataSerieVolumeBid];
renderableSeriesBid.xAxisId = kBaseChartAxisX;
renderableSeriesBid.yAxisId = kBaseChartAxisVolumeY;

[stackedGroup add:renderableSeriesBid];

SCIHorizontallyStackedColumnsCollection *horizontalStacked = [[SCIHorizontallyStackedColumnsCollection alloc] init];
[horizontalStacked add:stackedGroup];
horizontalStacked.xAxisId = kBaseChartAxisX;
horizontalStacked.yAxisId = kBaseChartAxisVolumeY;

[self.chartView.renderableSeries add:horizontalStacked];
- Andrei Sushynski answered 7 years ago
- You must login to post comments
DataSeries
self.chartBaseDataSeries = [[SCIOhlcDataSeries alloc] initWithXType:SCIDataType_DateTime
YType:SCIDataType_Double];
[self.dataSeries setObject:self.chartBaseDataSeries forKey:kChartDataSerieBase];

// volume series

SCIXyDataSeries *bidVolumeDataSerie = [[SCIXyDataSeries alloc] initWithXType:SCIDataType_DateTime
                                                                       YType:SCIDataType_Double];

[bidVolumeDataSerie setSeriesName:@"bidVolume"];

SCIXyDataSeries *askVolumeDataSerie = [[SCIXyDataSeries alloc] initWithXType:SCIDataType_DateTime
                                                                       YType:SCIDataType_Double];

[askVolumeDataSerie setSeriesName:@"askVolume"];

[self.dataSeries setObject:bidVolumeDataSerie forKey:kChartDataSerieVolumeBid];
[self.dataSeries setObject:askVolumeDataSerie forKey:kChartDataSerieVolumeAsk];
- Andrei Sushynski answered 7 years ago
- You must login to post comments
on scrool and data update use
[xAxis setVisibleRange:[[SCIDoubleRange alloc] initWithMin:SCIGeneric(visibleRangeMin + (isLeft ? barCount : -barCount))
Max:SCIGeneric(visibleRangeMax + (isLeft ? barCount : -barCount))]]
I will try to create small example
thanks
- Andrei Sushynski answered 7 years ago
- last edited 7 years ago
- You must login to post comments
Please login first to submit.


