Hi,
I have two question on iOS Chart.
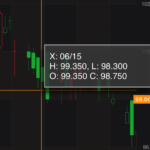
1.How can I customize the display value for tooltip generated by SCICursorModifier? I would like to set the following:
15/06/2017
O: 99.35
H: 99.35
L: 98.30
C: 98.75
The text color of OHLC value should be set according to prev. close value.
2.The function setVisibleRange is working for SCIDateTimeAxis but not SCICategoryDateTimeAxis
Here is the initialization of the axis:
id axis = [[SCICategoryDateTimeAxis alloc] init];
axis.axisId = @”X1″;
[axis setAutoRange:SCIAutoRange_Never];
[axis setVisibleRangeLimitMode:SCIRangeClipMode_MinMax];
[surface.yAxes add:axis];
Set the visible range after receiving the data
SCICategoryDateTimeAxis *xAxis = (SCICategoryDateTimeAxis *)[[surface xAxes] getAxisById:@”X1″];
[xAxis setVisibleRange:[[SCIDateRange alloc] initWithDateMin: Max:]];`
I tried to replace the axis type from SCICategoryDateTimeAxis to SCIDateTimeAxis, it works well. Any idea about this?
- Chris Yeung asked 6 years ago
- last edited 6 years ago
- You must login to post comments
Please login first to submit.

