Tell me, please, how best to organize the graph in the case when on the time axis we can have more than 100-1000 records within 1 second. The problem seems to be that the X value must be accurate to at least 1 second? How to make records with even greater accuracy. and at the same time the time on the axis was shown correctly for this kind of data?
- You must login to post comments
Hi Yevhenni,
Have you seen our documentation page on the DateTimeNumericAxis? this shows you how you can load unix date stamps into SciChart.js. These can be later converted to/from JavaScript Date type, theoretically allowing you any resolution
There’s a code example there of how to setup a DateTimeNumericAxis, and a codepen. You shouldn’t have a problem loading in 1,000 records with 1-second interval.
I’ve created you a custom codepen to demonstrate this. This includes functionality from the DateTimeNumericAxis documentation page and the LabelProvider page, which shows how to create a dynamic label provider with label formatting changing depending on zoom depth. This has 1,000 records with 1-second interval.
Try it out? If you find a specific bug or problem, please report it here on the forums. Sharing a codepen is the most helpful way for our engineers to understand the issue & fix problems.
Thank you!
-Andrew
- Andrew Burnett-Thompson answered 1 year ago
- You must login to post comments
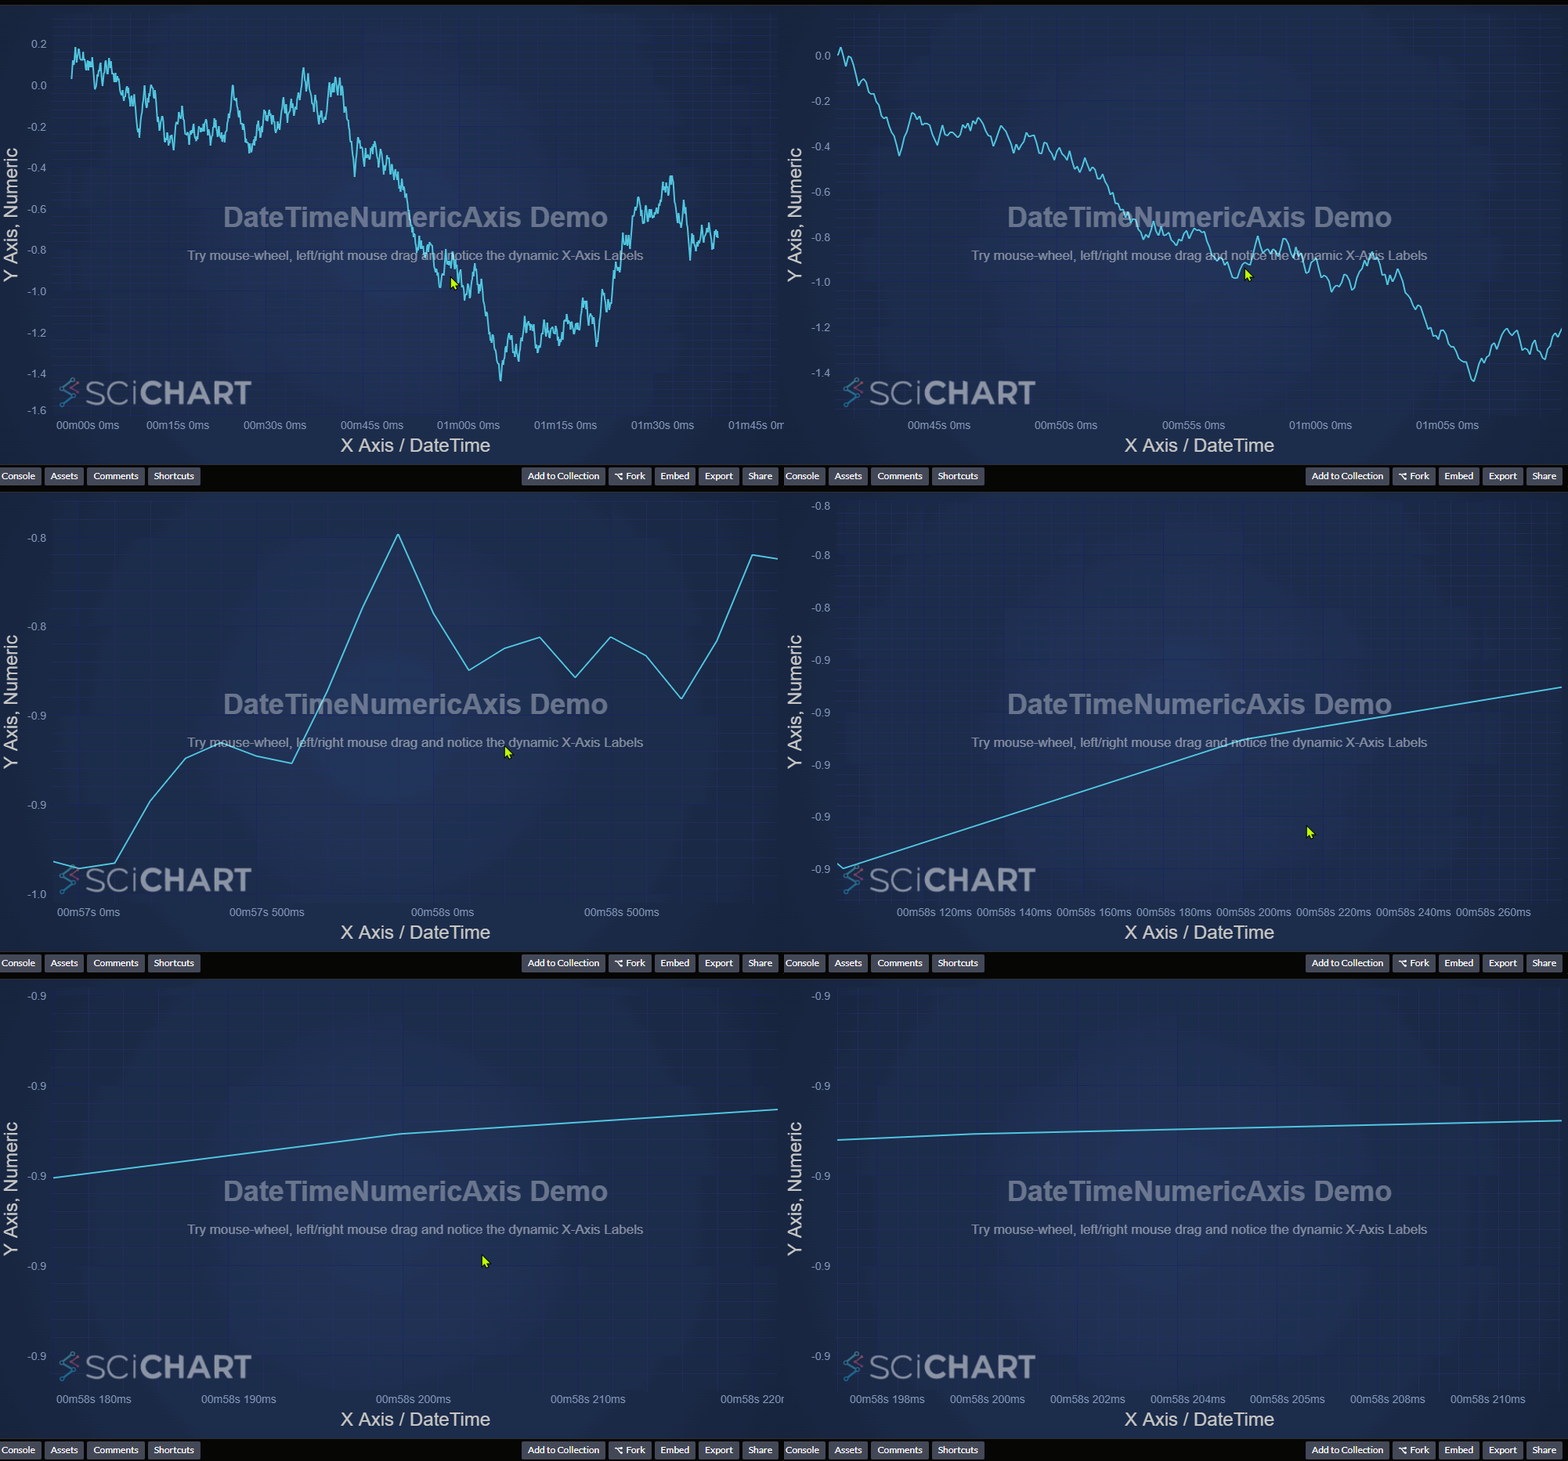
Update: we just noticed a bug(?) / issue where by the DateTimeNumericAxis won’t calculate deltas lower than 1 second.
This means that for resolutions below a second in SciChart.js you don’t get axis labels.
To fix this, in our Codepen we previously provided, we added a hint to suggest meaningful deltas that the axis can calculate. This is done as follows using the possibleDeltas property of an axis.
  const xAxis = new DateTimeNumericAxis(wasmContext, {
    axisTitle: "X Axis / DateTime",
    // Need to pass in smaller possible Deltas to allow for millisecond ticks
    possibleDeltas: [
        0.001,
        0.002,
        0.005,
        0.01,
        0.02,
        0.05,
        0.1,
        0.2,
        0.5,
        1,
        2,
        5,
        10,
        15,
        30,
        60,],
    labelProvider: new DynamicDateLabelProvider(),
  });
With that you can now zoom into milliseconds using SciChart.js and unix time stamps. Here’s a quick gif showing the zoom resolution down to milliseconds.

We’re going to address this in future releases, but for now, use possibleDeltas to extend precision of the date axis.
Best regards,
Andrew
- Andrew Burnett-Thompson answered 1 year ago
- You must login to post comments
Please login first to submit.
