Hi,
I am creating an application where, we fetch data and display it in multiple heatmaps. The user can manipulate the heatmaps with changing colormap or changing ranges on the colormap.
Data from these multiple heatmaps is composited to another chart for visualization.
I was able to get a reference to the series, but adding the series to another chart errors with a message:
Invalid operation in sciChartSurface.attachSeries, this series has already been attached to a SciChartSurface. Please detach it from a SciChartSurface before attaching to another

at BaseRenderableSeries.onAttach (BaseRenderableSeries.js:634:1)

at __webpack_modules__../node_modules/scichart/Charting/Visuals/SciChartSurface.js.SciChartSurface.attachSeries (SciChartSurface.js:1385:1)
of course this means we cannot attach the same series to two different charts, but is there a way around this such as deepcloning?
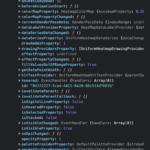
renderable series: attached image
sample code: attached image
- pramod butte asked 8 months ago
- last edited 8 months ago
 Hi Pramod, first question I’ll ask is why do you want to attach one series instance to two charts? What is the use case? This will help me to provide a correct solution. Secondly there is serialisation feature in every type in SciChart.js – its probably possible to serialise one series and deserialise onto another chart. But do you want to clone data as well as properties or just properties? – Andrew
- You must login to post comments
Dear Andrew,
Thank you for your prompt response.
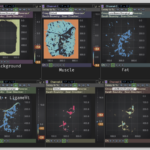
I am trying to add compositing capability to our existing application. Our application is designed to display multiple heatmaps which represent output of different machine learning algorithms.
In simple terms, we scan some biological images and identify the type of tissue present in the image using machine learning algorithms, each algorithm identifies one or more type of tissues e.g. fat, stroma, parenchyma, muscle etc… so we are able to visualize and manipulate the visualization the results of each ML in a separate heatmaps as show in first image. (tissuetypes.png)
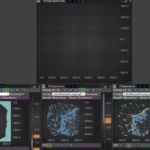
The goal is to take these individual heatmaps and composite them in a single “image / heatmap”, where the colormap and other characteristics can be manipulated on individual heatmaps and a composite image is displayed with controls to set opacity for each individual heatmap. attach:second image
We are trying to independently adjust each layer and see the result in the composite window
Hope this helps, let me know if you need more details.
Best,
Pramod
- pramod butte answered 8 months ago
 Got it, ok, that’s an interesting problem and an awesome application by the way. Let me circle back to the SciChart.js dev team and get you some ideas. I’m thinking combination of serialization/deserialization however there may be another way. Did you know: Heatmaps accept a 2D array (number[][]) and that part *can* be shared. Just the RenderableSeries cannot.
- You must login to post comments
Yes, I can use the same data and also sync various parameters such as (colormap, colormap ticks, opacity etc…) and apply to the new series in the compositing window.
But it seems such a round about way, when the series is already available. I was wondering if it can be deeCopied and then change the id… but then I realized the wasmcontext may be an issue as well.
Also I am not yet sure what is the compute cost of serialization / deserialization and will it lead to flawless use experience?
BTW while at it can you also tell me how can I overlay an image on top of the scan with an ability to vary its opacity. The image does not have the same resolution as the heatmap but it does have exact aspect ratio.
Thanks again for all your help,
Pramod
- pramod butte answered 8 months ago
- You must login to post comments
Hi Pramod,
OK I’ve had a go at creating a solution for you. Based on the first codepen in our JavaScript Heatmap Documentation and the Serialization/Deserialization API I’ve created a deepCopy function.
Find it in the Codepen here.
How this works. We create a heatmap series as normal but to clone it I’ve added a deepCopy function. This is defined as:
  // Now deepcopy the series
  const deepCopySeries = (series, includeData, seriesName) => {
    const excludeData = !includeData;
    // Serialize the series toJSON
    const json = series.toJSON(excludeData);
    // console.log(json);
    try {
      // using buildSeries, deserialize. This returns an array so take the first element
      const cloned = chartBuilder.buildSeries(
        wasmContext, // Must be wasmContext of the chart you want to place the series on
        json)[0];
      // Change the series Name
      cloned.dataSeries.dataSeriesName = seriesName;
      // Change the series ID so you can load two on same chart
      cloned.id = generateGuid();
      return cloned;
    } catch (error) {
      console.log(error.message);
    }
  };
Note the functions and types chartBuilder, generateGuid must be imported from “scichart”.
Next the clone is added back to the same chart. I offset the xStart, xStep to show that its a different series.
  // deepcopy/clone series including data and add on the chart
  const copySeries = deepCopySeries(heatmapSeries, true, "Cloned Heatmap");
  console.log(`I have a copied/cloned series ${copySeries}`);

  // Only point of this is to offset the clone so we can see it
  copySeries.dataSeries.xStart += 5;
  copySeries.dataSeries.yStart += 5;
  console.log(`I have a copied/cloned series ${copySeries}`);

  sciChartSurface.renderableSeries.add(copySeries);

  sciChartSurface.zoomExtents();
Some notes:
- If you are adding to a NEW chart then the
wasmContextpassed tochartBuilder.buildSeriesmust be the destination chart wasmContext. You can access this viasciChartSurface.webAssemblyContext2D - If you are adding to the SAME chart then you need to generate a new
series.id– which I have done above. - You can optionally clone a series without data by passing in
excludeData = trueto theseries.toJSON()function. This lets you do a shallow copy of series properties only. Otherwise, all data will be serialised (can be slow depending on dataseries size)
Let me know if this helps! If the solution works for you please upvote!
-Andrew
- Andrew Burnett-Thompson answered 8 months ago
- You must login to post comments
Thank you Andrew,
I am trying it now, at the baseline it works beautifully, even a small change in the colormap axismarker needs full serialization… which seems costly. I am trying out some hybrid methods, I will get back to you with my findings.
In the mean time, can you also help me with how to add an image (in our case it is the image of the exact scan, it has different resolution but exact same aspect ratio. I tried it as an svg annotation with image embedded in the svg, but scaling and alignment are not very intuitive to me.
Best,
Pramod
- pramod butte answered 8 months ago
 My suggestion to avoid serialization would be to create a factory function that instantiates heatmaps with parameters then you can just update the properties as you wish. Data can be shared on two charts but the actual series, no. About an image – sure – Should the image be the same size/shape as the heatmap and zoom and pan with it? I also suggest: new question = new forum post (or support ticket). Else things get lost.
- You must login to post comments
Please login first to submit.


