Hello,
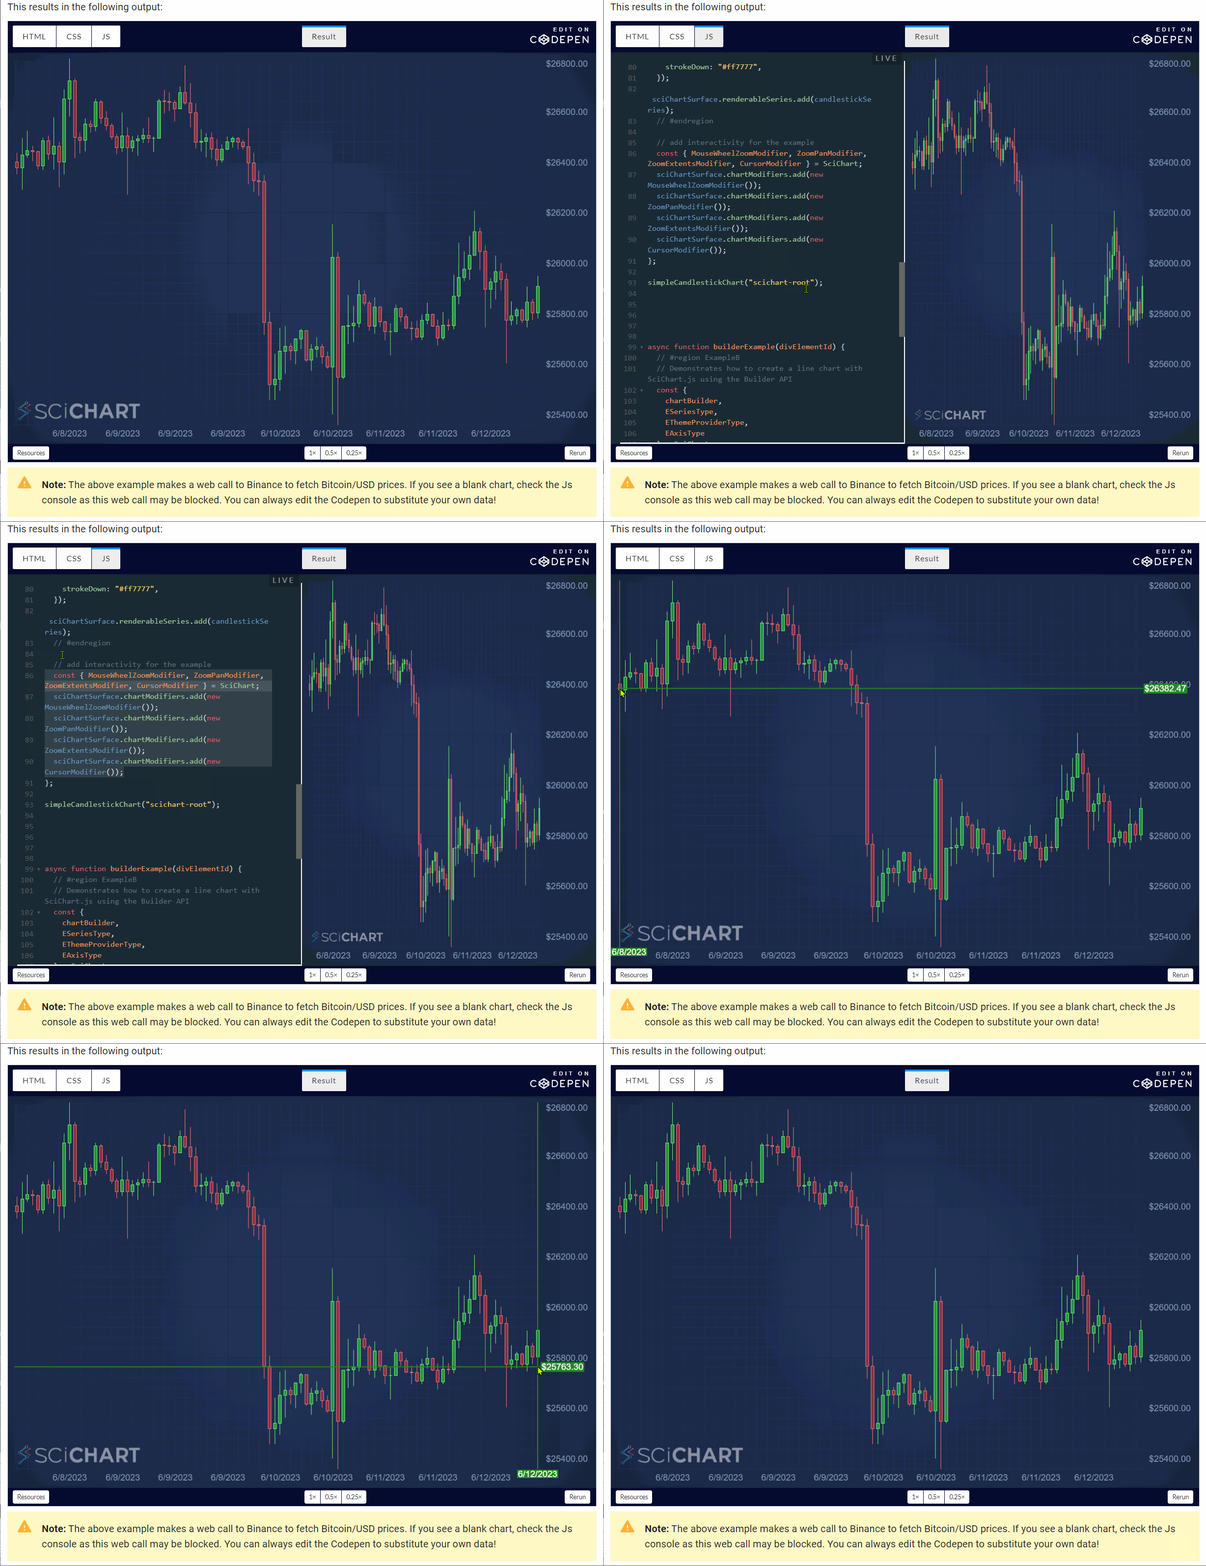
When annotations and the rollover modifiers are displayed on the very left side of a chart they align with the center of the candlesticks on the chart. However, as they get displayed toward the right side of the chart they get more and more offset to the right side of the candlestick.
Can anyone point me in the right direction to figure out how to fix this issue seemingly with my xAxis?
See attached screenshots,
- Leland asked 1 year ago
- You must login to post comments
Thank you for the reply, I will use this template going forward.
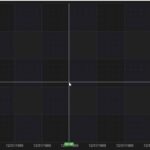
However, I think that the issue even just with the standard cursorModifier, the crosshairs are being displayed offset to the actual mouse cursor depending on where the mouse is at on the chart. See the new attached images. When the mouse cursor is in the left half of the chart the crosshairs are offset to the right, and when the mouse cursor is in the right half of the chart the crosshairs are offset to the left. So the crosshairs are only aligning with the user’s cursor in the exact center of the viewport.
- Leland answered 1 year ago
- You must login to post comments
Hi Leland,
Sounds like a bug in an older version of SciChart.js (v2.2). In the latest version (v3.1), by modifying the CodePen on our Candlestick Chart Documentation page, I can’t reproduce this.

Best regards
Andrew
- Andrew Burnett-Thompson answered 1 year ago
- You must login to post comments
This is using scichart 3.1.333 with blazor and JS interop.
_Layout.cshtml
<script src="https://cdn.jsdelivr.net/npm/[email protected]/_wasm/scichart.browser.js" crossorigin="anonymous"></script>
MainComponent.razor
protected override async Task OnAfterRenderAsync(bool firstRender)
{
    if (firstRender)
    {
        _mainChartModule = await JsRuntime.InvokeAsync<IJSObjectReference>("import", "./Pages/Strategy/MainComponent.razor.js");
        await _mainChartModule.InvokeVoidAsync("configureSciChart");
        await _mainChartModule.InvokeVoidAsync("createBaseChart", _chart);
    }
}
MainComponent.razor.js
let SciChartSurface = SciChart.SciChartSurface;
let NumericAxis = SciChart.NumericAxis;
let ZoomExtentsModifier = SciChart.ZoomExtentsModifier;
let ZoomPanModifier = SciChart.ZoomPanModifier;
let MouseWheelZoomModifier = SciChart.MouseWheelZoomModifier;
let WaveAnimation = SciChart.WaveAnimation;
let OhlcDataSeries = SciChart.OhlcDataSeries;
let FastCandlestickRenderableSeries = SciChart.FastCandlestickRenderableSeries;
let EXyDirection = SciChart.EXyDirection;
let RolloverModifier = SciChart.RolloverModifier;
let CategoryAxis = SciChart.CategoryAxis;
let NumberRange = SciChart.NumberRange;
let EAutoRange = SciChart.EAutoRange;
let ENumericFormat = SciChart.ENumericFormat;
let SciChartJSDarkTheme = SciChart.SciChartJSDarkTheme;
let EAxisAlignment = SciChart.EAxisAlignment;
let CursorModifier = SciChart.CursorModifier;
let FastLineRenderableSeries = SciChart.FastLineRenderableSeries;
let XyDataSeries = SciChart.XyDataSeries;
let EHorizontalAnchorPoint = SciChart.EHorizontalAnchorPoint;
let EVerticalAnchorPoint = SciChart.EVerticalAnchorPoint;
let BoxAnnotation = SciChart.BoxAnnotation;
let CustomAnnotation = SciChart.CustomAnnotation;
let LineAnnotation = SciChart.LineAnnotation;
let ECoordinateMode = SciChart.ECoordinateMode;
let SmartDateLabelProvider = SciChart.SmartDateLabelProvider;
let RubberBandXyZoomModifier = SciChart.RubberBandXyZoomModifier;
let EZoomState = SciChart.EZoomState;
let EExecuteOn = SciChart.EExecuteOn;
let RolloverModifierRenderableSeriesProps = SciChart.RolloverModifierRenderableSeriesProps;
let SeriesInfo = SciChart.SeriesInfo;
let AppTheme = SciChart.AppTheme;
let DateTimeNumericAxis = SciChart.DateTimeNumericAxis;

let chartInstances = {};
let _ohlcDataSeries;

export async function configureSciChart() {
    SciChartSurface.setRuntimeLicenseKey("...");
    SciChartSurface.useWasmFromCDN();
}

export async function createBaseChart(element) {
    let { sciChartSurface, wasmContext } = chartInstances.hasOwnProperty(element.id) && chartInstances[element.id];


    // initialize sciChart and add created chart to chartInstances
    if (sciChartSurface === undefined) {
        const newContext = await SciChartSurface.create(element.id);
        sciChartSurface = newContext.sciChartSurface;
        wasmContext = newContext.wasmContext;
        chartInstances[element.id] = { sciChartSurface, wasmContext };
    }

    let xAxis = new DateTimeNumericAxis(wasmContext, {
        // autoRange.never as we're setting visibleRange explicitly below. If you dont do this, leave this flag default
        autoRange: EAutoRange.Never
    });
    sciChartSurface.xAxes.add(xAxis);

    // Create a NumericAxis on the YAxis with 2 Decimal Places
    sciChartSurface.yAxes.add(
        new NumericAxis(wasmContext, {
            growBy: new NumberRange(0.1, 0.1),
            labelFormat: ENumericFormat.Decimal,
            labelPrecision: 2,
            labelPrefix: "$",
            autoRange: EAutoRange.Always
        })
    );
    // Optional: Add some interactivity modifiers
    sciChartSurface.chartModifiers.add(
        new ZoomExtentsModifier(),
        new ZoomPanModifier(),
        new MouseWheelZoomModifier(),
        new CursorModifier()
    );
}
- Leland answered 1 year ago
- You must login to post comments
I can’t reproduce this with the latest version of SciChart.js
Take the Candlestick Example from the documentation and click on ‘edit in codepen’
Add the following lines of code to add a rollovermodifier.
 candlestickSeries.rolloverModifierProps.markerColor = "White";
 // ..
 sciChartSurface.chartModifiers.add(new RolloverModifier());
The marker is centred on the candle close whether the rollover is on the left or right.
Anyway this isn’t the recommended approach for candlestick charts, instead, we recommend using a cursormodifier & external legend. Take a look at our Candlestick Chart Demo which does this. You get a really nice effect similar to TradingView where the legend on the top-left shows the OHLC values.
Best regards
Andrew
- Andrew Burnett-Thompson answered 1 year ago
- You must login to post comments
Please login first to submit.


