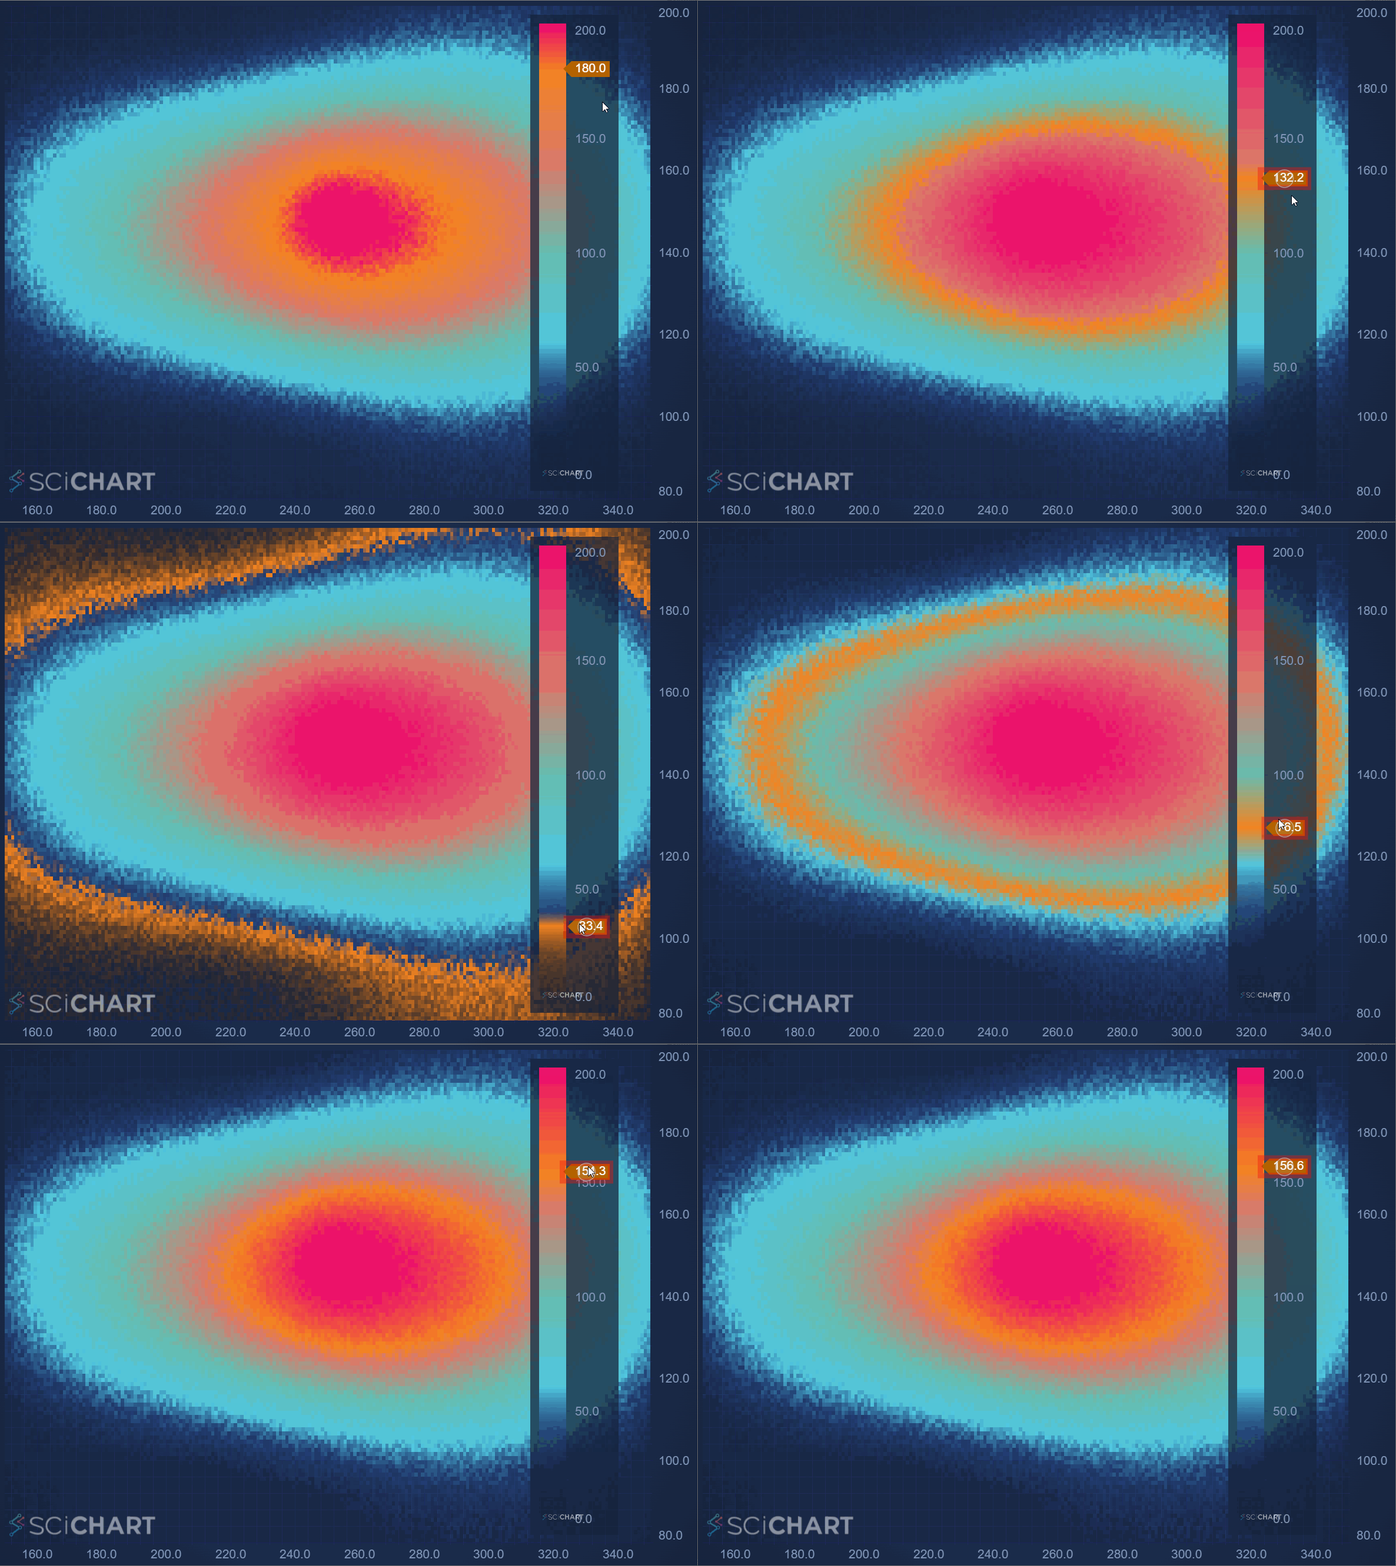
I am implementing a heatmap chart and would like to allow users to adjust the color mapping of the heatmap by adding sliders to the heatmap legend (Please refer to the attached screenshot). Does SciChart support color slider for HeatmapLegend?
- Quyen Sy asked 1 year ago
 Short answer, no, but the heatmap legend is just a SciChartSurface, so potentially could be customised like any other chart. Will think about this
 I am trying to do it by adding axis annotation to the heatmap legend but I don’t know how to modify the color mapping. I added another question about this: https://www.scichart.com/questions/js/how-can-i-modify-the-colormap-gradientstops-of-the-heatmap-series-and-the-heatmap-legend-while-the-chart-is-running
- You must login to post comments
Hi Quyen
Because of this and your other question about modifying gradient stops I created a quick codepen to try this behaviour out.
You’ve correctly found out that HeatmapLegend actually hosts an inner SciChartSurface. You can access it like this:
// Create the heatmapLegend with the same colorMap
const { heatmapLegend, wasmContext } = await HeatmapLegend.create(divElementIdLegend, {
  theme: {
    ...new SciChartJsNavyTheme(),
    sciChartBackground: "#14233CBB",
    loadingAnimationBackground: "#14233CBB",
  },
  colorMap // type HeatmapColorMap
});

// The HeatmapLegend is implemented using a SciChartSurface, You can access the inner chart
const legendSciChartSurface = heatmapLegend.innerSciChartSurface.sciChartSurface;
Once you have that you can add modifiers, annotations and configure it just like a SciChartSurface. It itself draws the colormap using a 1-Dimensional heatmap series.
I created a Codepen Here to show how to dynamically adjust the
colormap and also add an AxisMarkerAnnotation to the heatmap legend.
  // The HeatmapLegend is implemented using a SciChartSurface, You can access the inner chart
  const legendSciChartSurface = heatmapLegend.innerSciChartSurface.sciChartSurface;

  const axisAnnotation = new AxisMarkerAnnotation({
    y1: colorMap.maximum * 0.9,
    isEditable: true,
    onDrag: (args) => {

      // First step: prevent dragging outside the min/max
      if (axisAnnotation.y1 > 200) axisAnnotation.y1 = 200;
      if (axisAnnotation.y1 < 0) axisAnnotation.y1 = 0;

      const gradientStops = [
        { offset: 1, color: "#EC0F6C" },
        { offset: axisAnnotation.y1 / 200, color: "#F48420" },
        { offset: 0.7, color: "#DC7969" },
        { offset: 0.5, color: "#67BDAF" },
        { offset: 0.3, color: "#50C7E0" },
        { offset: 0.2, color: "#264B9377" },
        { offset: 0, color: "Transparent" },
      ];
      colorMap.gradientStops = gradientStops;
    }
  });
  legendSciChartSurface.annotations.add(axisAnnotation);
How this works:
- We create a SciChartSurface with X,Y Axis and add a heatmap series
- We create a single, shared HeatmapColorMap with gradientstops
- We create the HeatmapLegend, get it’s inner SciChartSurface and add an AxisMarkerAnnotation
- Subscribe to AxisMarkerAnnotation.onDrag and update the gradient stops
This results in the following output:

Try it out!
- Andrew Burnett-Thompson answered 1 year ago
- last edited 1 year ago
- You must login to post comments
Please login first to submit.

