Hi,
I have added a data series and also a custom box annotation which is overlapping the data series.
But the question is I am trying to move the box annotation which drag and drop but have to clip on the data series as well.
May I know if is scichart js able to do so? Or best if I just convert it into svg and make it drag and drop will do?
- eva yeoh asked 2 years ago
- You must login to post comments
Hi Eva
It’s not clear the exact behaviour that you want.
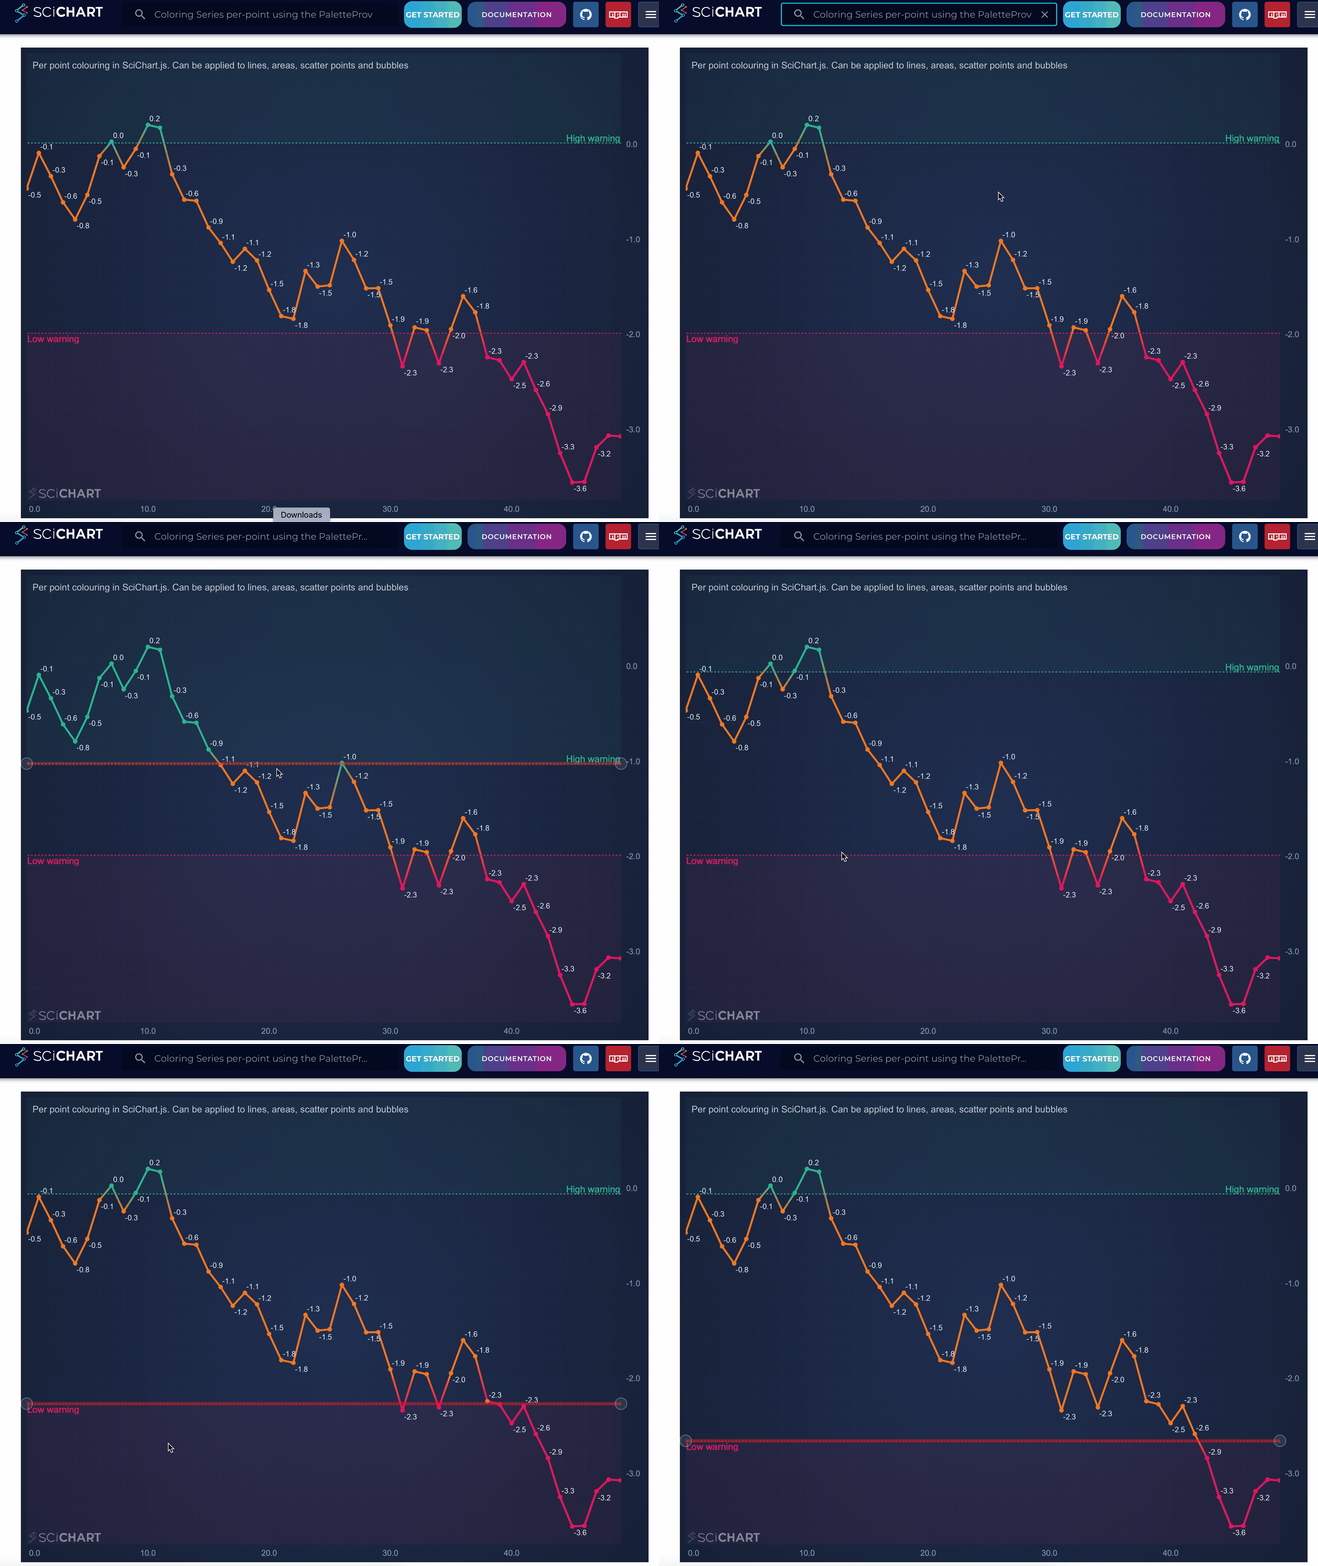
However, take a look at this demo: http://stagingdemo2.scichart.com/javascript-chart-color-points-individually-with-paletteprovider

In this demo, we have a line annotation and box annotation and bind one of the line.y1 coordinates to box.y1 coordinate so when you drag the line, the box updates.
Is that close to what you need? If not please specify more information.
NOTE: This is our staging demo for SciChart v3-alpha. This will be published soon.
Best regards
Andrew
- Andrew Burnett-Thompson answered 2 years ago
- You must login to post comments
Please login first to submit.
