Hi,
I’m trying to render a mountain series with different colors in specific ranges.
I understand that this could be done using the palette provider.
I have done that, but the chart is behaving in a very strange way.
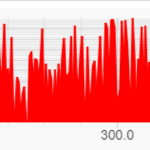
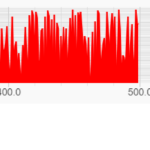
When dividing the chart to 2 color parts, when panning and scrolling it to a point that some of the points are out of window, the coloring starts to go crazy.
I have attached a few images that show the problem, and have also attached a file with the source code.
I have tested this on chrome version 116
Here’s the code
import {FastMountainRenderableSeries, XyDataSeries,ZoomPanModifier,EXyDirection,MouseWheelZoomModifier,NumericAxis,SciChartJSLightTheme, SciChartSurface, parseColorToUIntArgb, DefaultPaletteProvider, EStrokePaletteMode} from 'scichart'

SciChartSurface.UseCommunityLicense();
SciChartSurface.useWasmFromCDN();

class PaletteProvider extends DefaultPaletteProvider {
  constructor() {
    super();
    this.strokePaletteMode = EStrokePaletteMode.SOLID;
  }

  overrideStrokeArgb(xvalue) {
    return xvalue > 200 ? parseColorToUIntArgb('#ff0000') : undefined
  }

  overrideFillArgb(xvalue) {
    return xvalue > 200 ? parseColorToUIntArgb('#ff0000') : undefined
  }
}

const init = async () => {
  const {wasmContext, sciChartSurface} = await SciChartSurface.create('container', {theme: new SciChartJSLightTheme()})

  const xAxis = new NumericAxis(wasmContext);
  const yAxis = new NumericAxis(wasmContext);

  sciChartSurface.xAxes.add(xAxis)
  sciChartSurface.yAxes.add(yAxis)

  sciChartSurface.chartModifiers.add(new MouseWheelZoomModifier({xyDirection: EXyDirection.XDirection}))
  sciChartSurface.chartModifiers.add(new ZoomPanModifier({xyDirection: EXyDirection.XDirection}))

  const array = new Array(500).fill(0).map(val => Math.max(Math.random(), 0));
  const array2 = new Array(500).fill(0).map((val, index) => index);

  const dataSeries = new XyDataSeries(wasmContext)
  dataSeries.appendRange(array2, array);

  const series = new FastMountainRenderableSeries(wasmContext, {
    stroke: 'blue',
    fill: 'blue',
    strokeThickness: 3,
    zeroLineY: 0,
    dataSeries,
    paletteProvider: new PaletteProvider()
  })

  sciChartSurface.renderableSeries.add(series);
}

init();
Thanks for the help!
- haba haba asked 11 months ago
- last edited 11 months ago
- You must login to post comments
Hi
I was able to find and fix the bug today, and this has now been released in version 3.2.464. No need to set clipToXRange: false any more. It should just work at full performance.
We’re not always this fast, but we do try.
Regards
David
- David Burleigh answered 11 months ago
- You must login to post comments
Good morning
Thanks for the code sample & the bug report. The code file is TypeScript but I’m surprised this compiles – as your declaration of the PaletteProvider is incorrect (it should have 5 parameters – see here)
However, I’ve taken the sample from the the Mountain Series + PaletteProvider documentation and after clicking ‘Edit in Codepen’ managed to reproduce this error using your data + a ZoomPanModifier in the following codepen.
Ive put this in front of the team at the standup and we’ve logged a bug report here: SCJS-1598, we will investigate shortly.
Best regards
Andrew
- Andrew Burnett-Thompson answered 11 months ago
- last edited 11 months ago
- You must login to post comments
Hi
In 3.2 we introduced a feature where the chart only draws data that is actually visible according to the x range. This fixed a performance issue when zoomed far into a very large (10000+ points) dataset. However it does appear to be causing problems with PaletteProvider for reasons that are not immediately obvious.
The good news is that you can disable this feature and fix this PaletteProvider issue by setting
clipToXRange: false on your X axis.
We will continue to try and get this working properly in all cases.
Regards
David
- David Burleigh answered 11 months ago
- last edited 11 months ago
- You must login to post comments
Thank you for your help!
Unfortunately, I have a few million points that I need to show on my chart, so I cant disable this property.
Could you give me an estimate as to when this could be solved? I am unfamiliar with your version release cycles and how often you do it. Could this be resolved within days, weeks or months?
Thanks again!
- haba haba answered 11 months ago
- last edited 11 months ago
 Hi there, our release cycle is typically quite fast. If we find a solution it could be released in the next couple of days or 1-2 weeks max. However, we need to investigate it first. My suggestion in the meantime: Try the workaround that David suggested. Setting `clipToXRange: false` on the XAxis disables viewport culling *only* in the case where there is a very large dataset *and* you are zoomed in to a very low level. Therefore in many cases this won’t even affect performance but it will fix this glitch/bug with PaletteProvider. Then, when there is a fix you can remove the workaround. Hope this helps! Best regards, Andrew
- You must login to post comments
Please login first to submit.


