Hi!
I have chart with mountain series with a palette provider.
It performs extremely well with 50k points.
However, I noticed that when I drag the chart away, to a point where the series is not visible, the performance sinks and the chart is extremely laggy.
I have uploaded my code to codepen: https://codepen.io/robrob123/pen/KKJjyvp
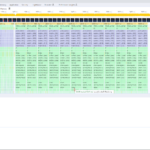
I checked the performance using the chrome performance profiler and I found that a function called applyStrokeFillPalletting is called repeatedly many times and each time it takes way too long to execute, considering there is no series to draw.
I have attached a screenshot showing the performance profiling.
Thank you!
- Roger Cooper asked 4 months ago
- You must login to post comments
Thanks for this report. I’ve confirmed there is an issue with how the indexes of points to be drawn/paletted is calculated when the whole series is off screen.
We will hopefully get this fixed quickly and let you know when an update is ready.
Regards
David
- David Burleigh answered 4 months ago
 This fix is now released in v3.2.543
- You must login to post comments
Great!
Could you estimate how much time this could take to fix? days or weeks?
Thanks!
- Roger Cooper answered 4 months ago
- last edited 4 months ago
- You must login to post comments
Please login first to submit.

