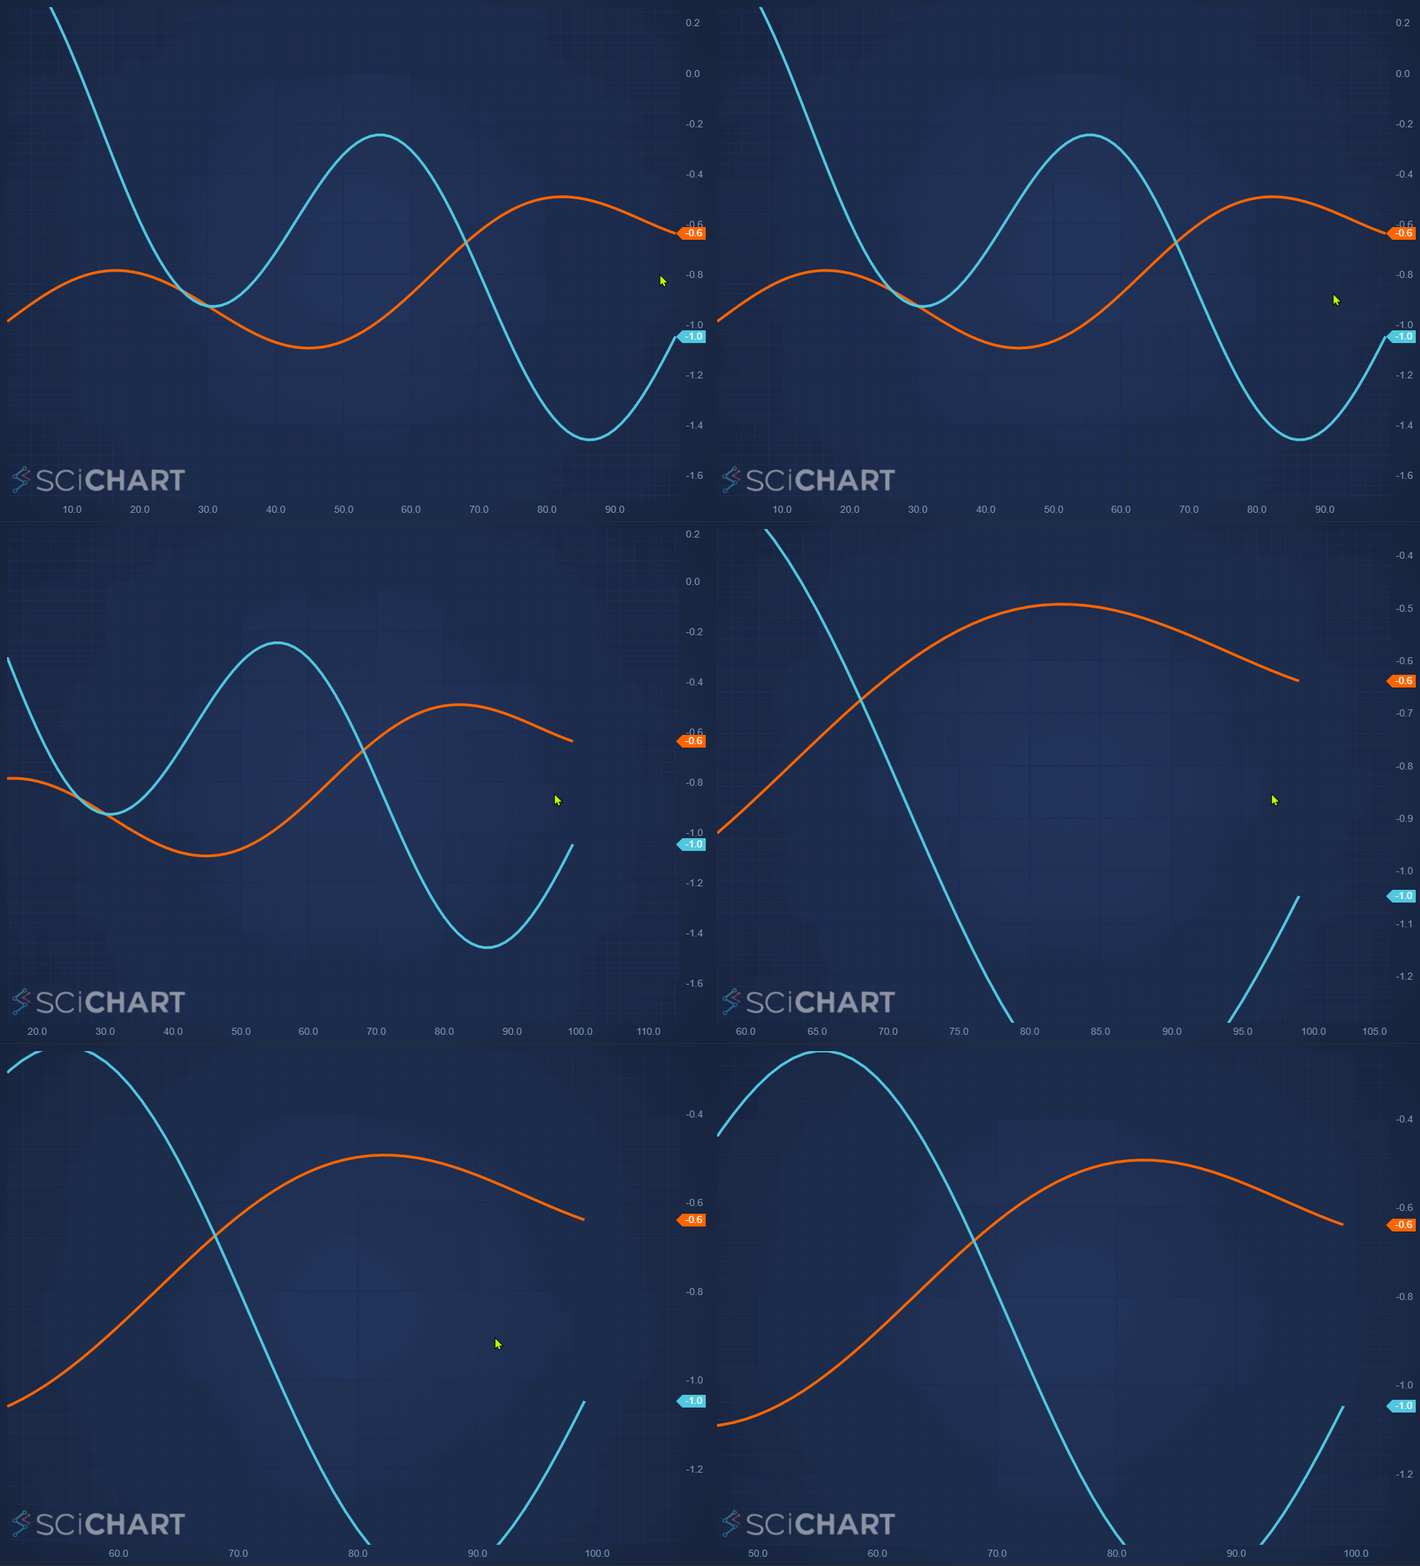
Hello,
tell me please, how can I add such indicators on yAxis. Maybe you have some example on sandbox for JS.
Thank you!
- You must login to post comments
Hi Yevhenii,
In the WPF (Windows) version of SciChart we have a feature called SeriesValueModifier. This places AxisMarkerAnnotations on the right axis at the last value of each series.
In SciChart.js, we don;t have this modifier, however it’s possible to write your own and place AxisMarkerAnnotation. I’ve created a sample below.
Here’s a codepen for you: https://codepen.io/scichart/pen/JjepwgZ

Here’s how this works:
- I have created a new class extending CustomChartModifier2D – part of our custom ChartModifier API
- I override onParentSurfaceRendered() from the base class. This is called whenever the chart draws
- In here I maintain and synchronise a Map of Annotation to RenderableSeries. These contain AxisMarkerAnnotation instances which are put on the main chart
- Finally, I set AxisMarkerAnnotation.y1 to the last series value and background/foreground color to series stroke
Here’s the class I created
 class SimpleSeriesValueModifier extends CustomChartModifier2D {
  constructor() {
    super();
    this.annotationsBySeries = new Map();
  }

  // override onParentSurfaceRendered from the base class. Called when the chart redraws
  onParentSurfaceRendered() {
    super.onParentSurfaceRendered();

    // Manage annotation lifecycle
    if (this.parentSurface.renderableSeries.size() !== this.annotationsBySeries.size) {
      this.resetAllMarkers();
      this.createMarkers();
    }

    // Update annotation placement
    this.annotationsBySeries.forEach((series, annotation) => {
      const count  = series.dataSeries.count();
      if (count === 0) {
        annotation.isVisible = false;
        return;
      }
      const lastYValue = series.dataSeries.getNativeYValues().get(count - 1);
      annotation.y1 = lastYValue;
      annotation.isVisible = true;
    });
  }

  // override onDetach resetting the state
  onDetach() {
    super.onDetach();
    this.resetAllMarkers();
  }

  resetAllMarkers() {
    this.annotationsBySeries.forEach((series, annotation) => {
      this.parentSurface.annotations.remove(annotation);
      annotation.delete();
    });
    this.annotationsBySeries.clear();
  }

  createMarkers() {
    this.parentSurface.renderableSeries.asArray().forEach(series => {
      const annotation = new AxisMarkerAnnotation({
        // Axis marker fill
        backgroundColor: series.stroke,
        // Axis text color
        color: "White",
        // TODO: You could choose white or black for text depending on the color of the series
        // TODO: You could choose a different property from the series for different series types, e.g. candle, mountain, column
      });
      this.annotationsBySeries.set(annotation, series);
      this.parentSurface.annotations.add(annotation);
    });
  }
}
// Usage
  sciChartSurface.chartModifiers.add(new SimpleSeriesValueModifier());
Some ideas to extend this.
- If you wanted to show Red/Green AxisMarkerAnnotation based on candlestick up or down, then get the open, high, low, close values from dataseries for latest value and compute if the candle is up or down
- You might want to consider how to format labels to number of decimal places. Set AxisMarkerAnnotation.formattedYValue
- You might want to change AxisMarkerAnnotation.color (foreground text color) depending on how dark or light the outline is.
Let me know if this helps!
Best regards
Andrew
- Andrew Burnett-Thompson answered 9 months ago
- last edited 9 months ago
- You must login to post comments
Someone asked “How do I display the latest Y-Value in the viewport, and change appearance of the Y Axis Marker” (see forum post)
To do this, I’ve extended the previous codepen:
const lastYSimpleMode = () => {
     const lastYValue = series.dataSeries.getNativeYValues().get(count - 1);
     annotation.y1 = lastYValue;
     annotation.isVisible = true;
 };
This is the previous method where we find the last Y-value in a data series, and set the AxisMarkerAnnotation.y1 equal to that value.
However to extend it so that the annotation is displayed at last y-value in the viewport:
const lastYInViewportMode = () => {
   const wc = this.parentSurface.webAssemblyContext2D;
const lastX = series.xAxis.visibleRange.max;
const lastXIndex = wc.NumberUtil.FindIndex(series.dataSeries.getNativeXValues(), lastX, wc.SCRTFindIndexSearchMode.Nearest, series.dataSeries.dataDistributionCalculator.isSortedAscending);

const lastY = series.dataSeries.getNativeYValues().get(lastXIndex);
annotation.y1 = lastY;
annotation.isVisible = true;
annotation.opacity = lastX >= series.dataSeries.getNativeXValues().get(count - 1) ? 1.0 : 0.5;
};
This mode finds the latest x-value in the viewport, then the index to that x-value in the data series. Finally, it finds the corresponding y-value.
The result can be viewed in the same Codepen as posted.
- Andrew Burnett-Thompson answered 8 months ago
- last edited 8 months ago
- You must login to post comments
Please login first to submit.

