I am trying to subscribe to Visible Range changes on a DateTimeNumericAxis, it is not working, am I doing something wrong?

- Jhonatan Laguna asked 5 months ago
- You must login to post comments
Hi Jhonatan,
On the documentation page Axis Ranging – How to Listen to VisibleRange Changes we have an embedded codepen showing how to subscribe to and listen to visible range changes.
The code is quite simple:
// Create a chart with X,Y axis
const { wasmContext, sciChartSurface } = await SciChartSurface.create(divElementId, {
theme: new SciChartJsNavyTheme()
});
sciChartSurface.xAxes.add(new NumericAxis(wasmContext));
sciChartSurface.yAxes.add(new NumericAxis(wasmContext));
// Add a label showing the status
const textAnnotation = new TextAnnotation({
text: "Drag to pan the chart",
...options
});
sciChartSurface.annotations.add(textAnnotation);
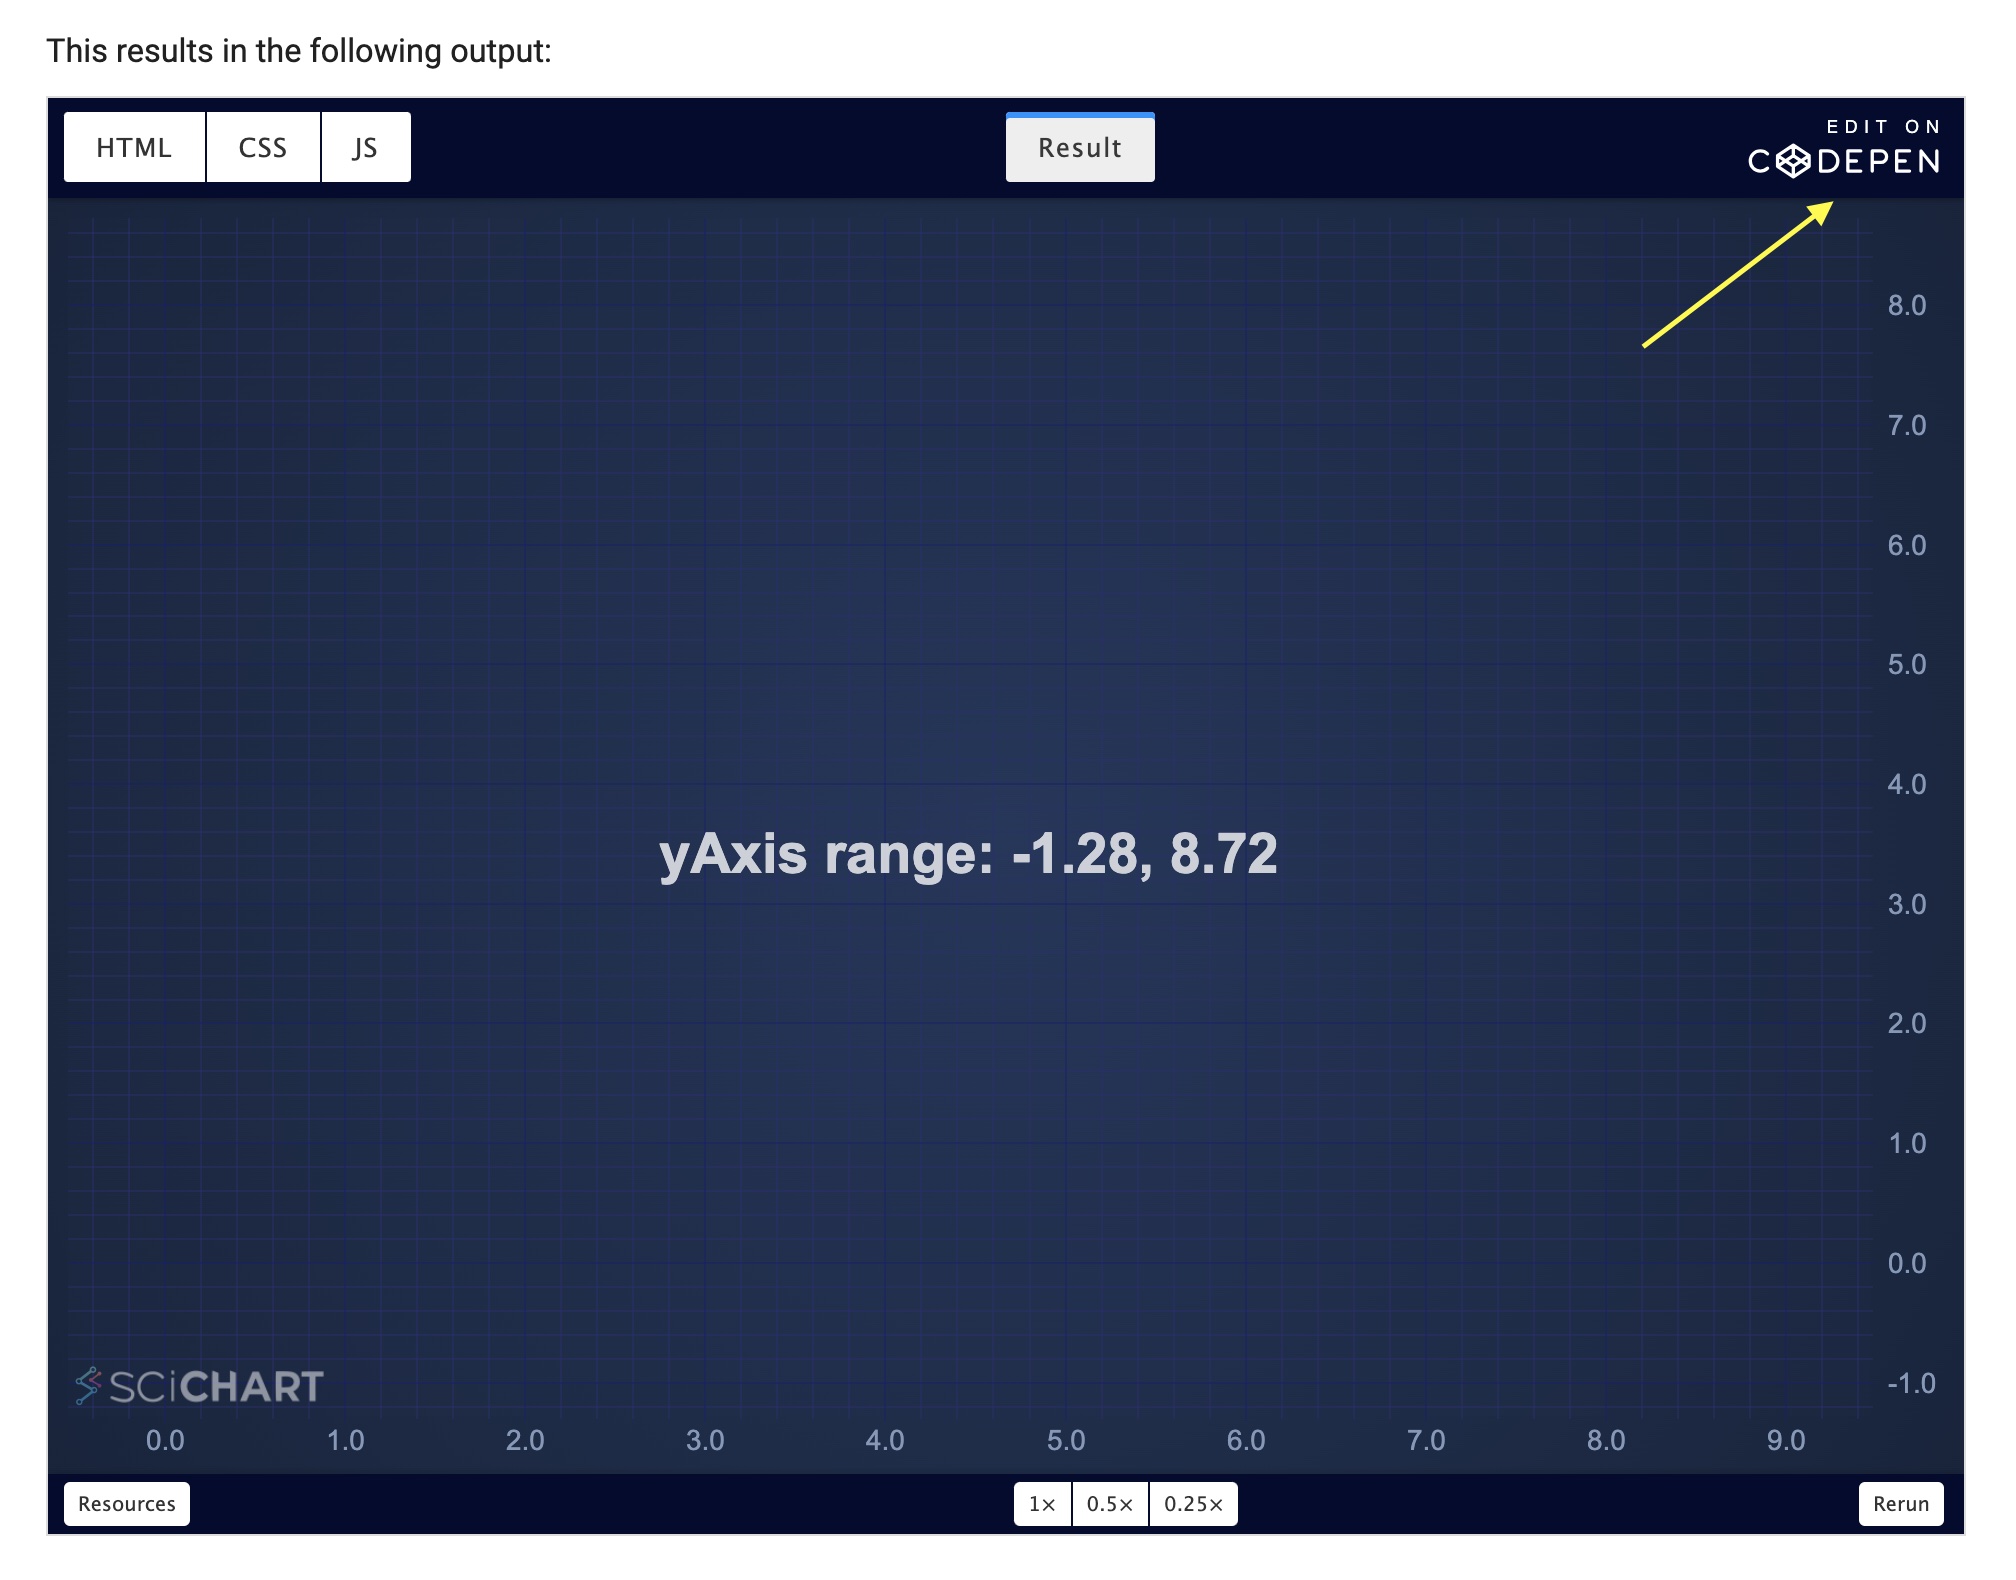
// subscribe to visibleRangeChanged on yAxis
sciChartSurface.yAxes.get(0).visibleRangeChanged.subscribe((args) => {
const message = `yAxis range: ${args.visibleRange.min.toFixed(2)}, ${args.visibleRange.max.toFixed(2)}`;
console.log(message);
textAnnotation.text = message;
});
Head over to the docs, and click on the ‘Codepen’ button here:
Next, adjust the code – replace xAxis for a DateTimeNumericAxis. Subscribe to visibleRangeChanged on the xAxis
  sciChartSurface.xAxes.add(new DateTimeNumericAxis(wasmContext));
  // ...

 sciChartSurface.xAxes.get(0).visibleRangeChanged.subscribe((args) => {
    function convertDate(range) {
       return sciChartSurface.xAxes.get(0).labelProvider.formatLabel(range);
    }
    const message = `xAxis range: ${convertDate(args.visibleRange.min)}, ${convertDate(args.visibleRange.max)}`;
    console.log(message);
    textAnnotation.text = message;
  });
This will output dates on the x-axis and allows you to try out visibleRangeChanged on this axis type.
Note: that the conversion function above – is quite simple. It uses the label provider to convert from number (internally stored
value on DateTimeNumericAxis) to date. There are a number of
formatting functions in SciChartjs which can help you. Some are
outlined below. All are accessible viaimport <functionName> from 'scichart'
formatUnixDateToHumanString()formatUnixDateToHumanStringDD()formatUnixDateToHumanStringDDMM()formatUnixDateToHumanStringDDMMHHMM()formatUnixDateToHumanStringDDMMYY()formatUnixDateToHumanStringHHMM()formatUnixDateToHumanStringHHMMSS()formatUnixDateToHumanStringMMM()formatUnixDateToHumanStringMMMDD()formatUnixDateToHumanStringYYYY()As an example I’ll past the code for
formatUnixDateToHumanStringMMMDD()below in case you want to write
your own formatting function or conversion function to convert from
DateTimeNumericAxis.visibleRangeto Date / Time in scichart.jsexport const formatUnixDateToHumanStringMMMDD = (unixTimestamp: number): string => { const date = new Date(unixTimestamp * 1000); const month = date.getUTCMonth(); const day = date.getUTCDate(); if (isNaN(month) || isNaN(day)) { return ""; } return `${getMonthString(month)} ${day}`; };
- Andrew Burnett-Thompson answered 5 months ago
- You must login to post comments
Please login first to submit.
