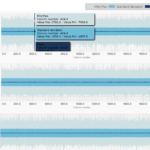
Hello, i want to customize tooltip in graph (SplineBandRenderableSeries), i can change the tooltip content but if i return svg like your example ( return <svg width="${width}" height="${height}">))
<circle cx="50%" cy="50%" r="50%" fill="${tooltipColor}"/>
<svg width="100%">
<text y="40" font-size="13" font-family="Verdana" dy="0" fill="${tooltipTextColor}">
<tspan x="15" dy="1.2em">${tooltipTitle}</tspan>
<tspan x="15" dy="1.2em">x: ${seriesInfo.formattedXValue} y: ${seriesInfo.formattedYValue}</tspan>
</text>
</svg>
</svg>
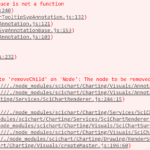
It doesn’t work. I have this error in console: Error from chart in div band0 TypeError: valuesWithLabels.reduce is not a function
and
Error from chart in div band0 DOMException: Failed to execute ‘removeChild’ on ‘Node’: The node to be removed is not a child of this node.
at RolloverTooltipSvgAnnotation.delete …
My graph has 3 renderableSeries (1 XyDataSeries and 2 XyyDataSeries)
Please can you send me an example in (javascript) for modify tooltip styling ?
Thanks.
- Marjorie lesage asked 1 year ago
 Hi Marjorie, going to work on this asap and get you a sample. Best regards, Andrew
- You must login to post comments
Hello, here is an example. Let us know if similar works on your side.
See the Pen
CustomRolloverTooltip by Jim (@jim-risen)
on CodePen.
- Jim Risen answered 1 year ago
- You must login to post comments
Thank you so much, it’s work
- Marjorie lesage answered 1 year ago
- last edited 11 months ago
- You must login to post comments
Please login first to submit.


