Hello I have been having a difficult time getting the correct time displayed on my xAxis and labels.
Passing in an xValue to an OHLC data series of 60 and the setting cursorLabelFormat: ENumericFormat.Date_DDMMHHMM this should produce a label “01/01 00:01” With the year as 1970.
When the computers timezone is set to UTC + 0 this behaves as expected.
However when the computers timezone is set to anything negative (UTC – 7) the label is formatted as “31/12 00:01” with the year 1969. If scichart is trying to convert to local time I would expect a reading of “31/12 17:01” 1969.
And when the timezone is set to anything positive (UTC + 7) the label is formatted as it is UTC +0 “01/01 00:01” 1970 again I would expect the hour to corrispond to the UTC offset if scichart is trying to convert to local time.
Looking at the later case I would assume that no time conversion is taking place which is what I would prefer. But looking at the former case (UTC -X) there appears to be some manipulation happening somewhere, I just have not been able to find any documentation explaining this. Am I missing something to get this to work properly out of the box without a custom label provider?
Thank you,
Update:
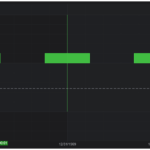
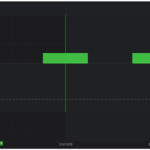
I do not want to worry about timezones. I want sciChart to plot the time that I give it. Again this is acting as expected when the computer timezone is in anything greater than UTC 0. But when the computer timezone is less than UTC 0 the label and axes are showing a date 24 hours prior to what I give it.
See attached images for the error. Note the only change that is happening is changing the computer timezone from UTC – 4 to UTC + 4.
See below for code setting up the chart.
Why is changing the computer timezone affecting the data labels?
export async function example(element) {
    let { sciChartSurface, wasmContext } = chartInstances.hasOwnProperty(element.id) && chartInstances[element.id];

    // initialize sciChart and add created chart to chartInstances
    if (sciChartSurface === undefined) {
        const newContext = await SciChartSurface.create(element.id);
        sciChartSurface = newContext.sciChartSurface;
        wasmContext = newContext.wasmContext;
        chartInstances[element.id] = { sciChartSurface, wasmContext };
    }

    //create and add xAxis
    let xAxis = new CategoryAxis(wasmContext, {
        drawLabels: true,
        drawMajorTickLines: true,
        drawMinorTickLines: true,
        axisAlignment: EAxisAlignment.Bottom,
        autoRange: EAutoRange.Once,
        cursorLabelFormat: ENumericFormat.Date_DDMMHHMM,
        labelFormat: ENumericFormat.Date_DDMMYYYY,
    });

    sciChartSurface.xAxes.add(xAxis);

    //create and add yAxis
    let yAxis = new NumericAxis(wasmContext, {
        maxAutoTicks: 5,
        autoRange: EAutoRange.Always,
        growBy: new NumberRange(0.3, 0.11),
        axisAlignment: EAxisAlignment.Right,
        labelPrecision: 4
    });
    sciChartSurface.yAxes.add(yAxis);

    //add chart modifiers
    sciChartSurface.chartModifiers.add(new ZoomPanModifier({ xyDirection: EXyDirection.XDirection }));
    sciChartSurface.chartModifiers.add(new ZoomExtentsModifier({ xyDirection: EXyDirection.XDirection }));
    sciChartSurface.chartModifiers.add(new MouseWheelZoomModifier({ xyDirection: EXyDirection.XDirection }));
    sciChartSurface.chartModifiers.add(new RolloverModifier({ modifierGroup: "first", showTooltip: false }));
    sciChartSurface.chartModifiers.add(new CursorModifier(
        {
            crosshairStroke: "#9598a1",
            crosshairStrokeDashArray: [10, 5],
        }));

    //apply desired theme
    sciChartSurface.applyTheme(new SciChartJSDarkTheme());

    //create three bars
    _ohlcDataSeries = new OhlcDataSeries(wasmContext, {
        xValues: [60,120,180], //1 min, 2 min, 3 min post epoch
        openValues: [10,10,10],
        highValues: [15,15,15],
        lowValues: [5,5,5],
        closeValues: [11,11,11],
        dataSeriesName: "PriceDataSeries"
    });

    //create and style fastCandRendSeries
    const fcRendSeries = new FastCandlestickRenderableSeries(wasmContext,
        {
            dataSeries: _ohlcDataSeries,
            strokeThickness: 1,
            dataPointWidth: 0.5,
            brushUp: "#50ff50B2",
            brushDown: "#ff5050B2",
            strokeUp: "#50ff50",
            strokeDown: "#ff5050",
            animation: new WaveAnimation({ fadeEffect: true, duration: 800 })
        });
    sciChartSurface.renderableSeries.add(fcRendSeries);
}
- Leland asked 2 years ago
- last edited 2 years ago
- You must login to post comments
Date and time handling and formatting in pure JS is awkward, and we avoid having any external dependencies in scichart, so our date formatting for labels is fairly basic and assumes the data is UTC. If you need to worry about timezones, the best approach is to pull in a good date library like Date.js or moment.js and use it to create a custom formatLabel function for your labelProvider. You can set this on an axis without having to create an entire custom label provider, as shown in the first example here https://www.scichart.com/documentation/js/current/webframe.html#Axis%20Label%20Formatting%20-%20Custom%20LabelProviders.html
Regards
David
SciChart Ltd
- David Burleigh answered 2 years ago
 I do not wish to worry about timezones. Please see my updated post for screenshots and code showing the issue further.
- You must login to post comments
Please login first to submit.


