Hi,
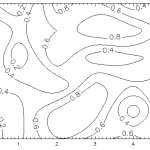
Can you tell me if it is possible to make a contour plot like on the image i have attached?
I cant seem to find a way to do that.
Best regards,
Jeppe
- You must login to post comments
It is possible to create a Heatmap and add some annotations on it currently. This will give the closest view possible with SciChart. Is it suitable?
Unfortunately, contour chart isn’t supported directly for now. You could post this request by contacting us as a feature request and we will consider implementing it in future.
Best regards,
Yuriy
- Yuriy Zadereckiy answered 10 years ago
 Thanks for the reply, i have submitted the request.
 Great!:) ..and I have one more idea for you: would it be suitable to use XyDataSeries in order to draw each contour for now? Please, take a look at our Oscilloscope example to see unsorted data in action, switch to Lissajous series using the dropdown list at the top left corner. Hope this helps!
 Thanks for suggesting this! I will take a look at this example.
- You must login to post comments
Please login first to submit.

