Dear all,
I try to study your tool from trial version sample . Frist simple graph I look at is Band Series chart and when checking it I get some missunderstanding hope you can light up my brain.
First of all it has a on left a button call Toggle Zoom Pan button with direction list. what ever I select in this list I do not see what is the effect on this actually on the zoom, can you explain how can I see the effect ?
Second wierd question I have is that is use a yyDataSeries where we need to provide 1 X and 2 Y, what does it means exactly?
Does it means that the data source have same x values but 2 y ?
What if the source of data have 2 different x and y values ?
Thanks to clarify
regards
- sc sc asked 6 years ago
- You must login to post comments
catch it from an other sample which make it more clear to me
regards
- sc sc answered 6 years ago
- You must login to post comments
Hi there,
The toolbar options on the left enable different zoom and pan options. You have to mouse-down on the chart to zoom or pan, like this.
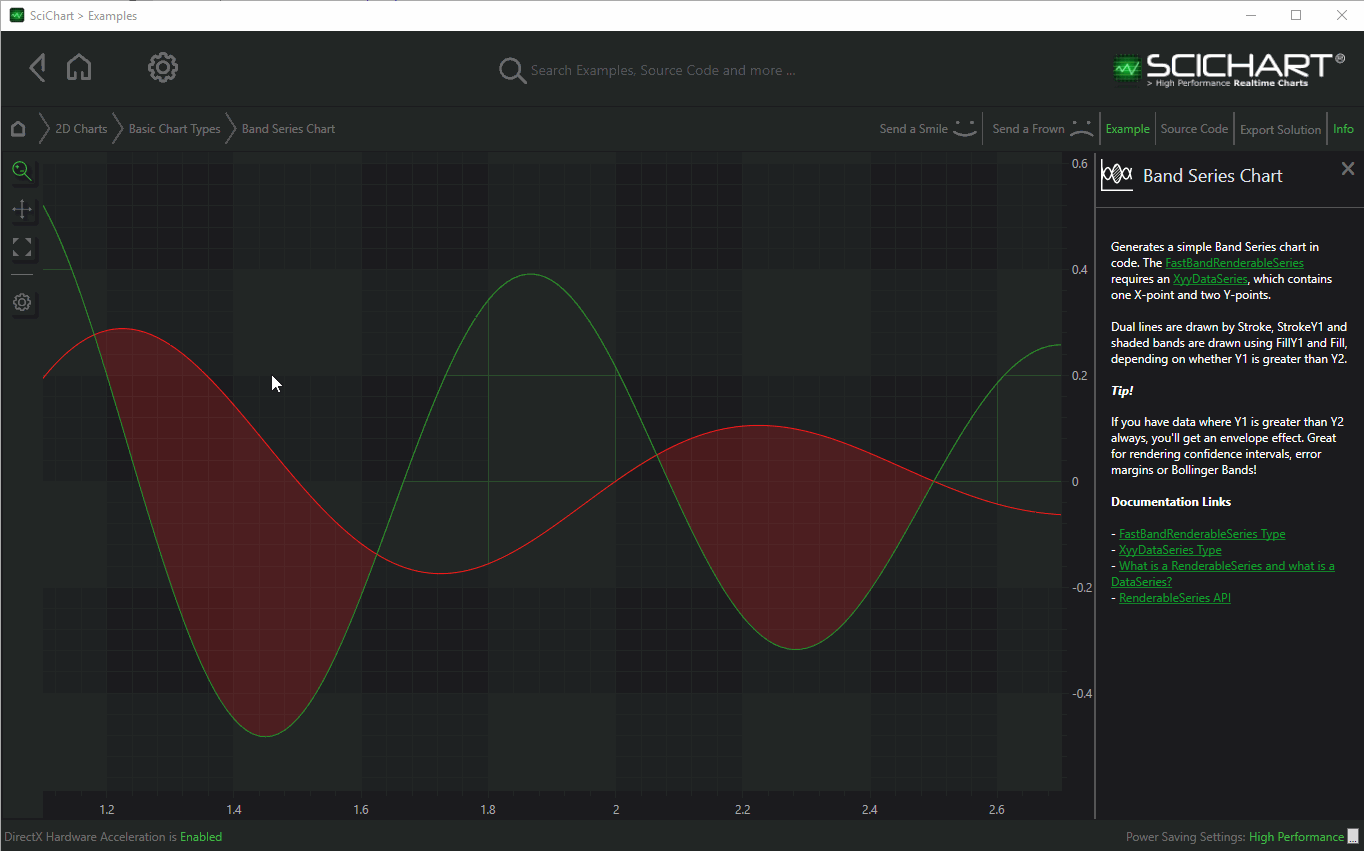
Regarding Y0, Y1, yes you need an XyyDataSeries. There is documentation on this series type here which explains how it works.
Best regards,
Andrew
- Andrew Burnett-Thompson answered 6 years ago
- You must login to post comments
Please login first to submit.
