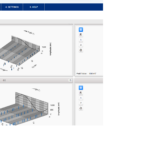
I am currently using the ImpulseRenderableSeries3D chart for dynamic data plotting, but I’ve encountered an issue where the data points are sometimes being plotted outside the axis boundaries. I have attached an image to illustrate the problem. Could you please assist me in addressing this issue?
Thank you
- Ammar Khan asked 3 months ago
- You must login to post comments
Hi Ammar,
Thanks for your inquiry. I am sorry for the late reply.
I discussed this with our team.
Please try setting the AutoRange property to Always for the Axis3D. Enabling this should update the VisibleRange correspondingly to the plotted dataset.
You can find more details regarding our Axis 3D API in the corresponding documentation article here:
https://www.scichart.com/documentation/win/current/webframe.html#Axis_3D_APIs.html
Please let us know if this helps.
With best regards,
Lex,
SciChart Technical Support Engineer
- Lex answered 3 months ago
- You must login to post comments
I have a question related to this.
In my application I have both 2D and 3D graphs.
I have a UI which allows the user to set the range for an axis.
On the 2D graphs, I use this to set the VisibleRange of the NumericAxis and set AutoRange to Never. The graph then re-draws as expected with the range of the axis set to that entered and the data plotted is clipped to the graph extents. All good.
On the 3D graphs (a SciChart3dSurface with a SurfaceMeshRenderableSeries3D) this does not work. When I programmatically set the VisibleRange on the NumericAxis3D, the axis re-draws to the required length, but the plotted surfaces extends beyond the range of the axis! (in a way similar to the original poster of this thread). Why does this not clip as for the 2D NumericAxis? Can it be made to do so? How can I programmatically set the axis range? Do I have to replot or adjust the data in the UniformGridDataSeries3D?
Thanks
Andrew M
- Andrew Milford answered 2 months ago
 Hi Andrew, you both need clipping to Axis Cube bounds. I will notify the WPF team and see what we can do!
- You must login to post comments
Please login first to submit.

