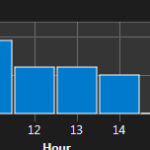
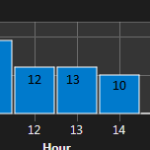
Hi I’m just wondering if there is anyway to force Y values to show up on the chart for all data points like a Histogram. I’ve attached screenshots to show what I would like the final screen to look like (ChartTest) so you have an idea. Hoping there is a way to force rollover to always show, or maybe have axis markers on the bottom that can display the y value at each x point. Hopefully you understand what I’m trying to achieve. Thanks.
- Kohins asked 11 years ago
- You must login to post comments
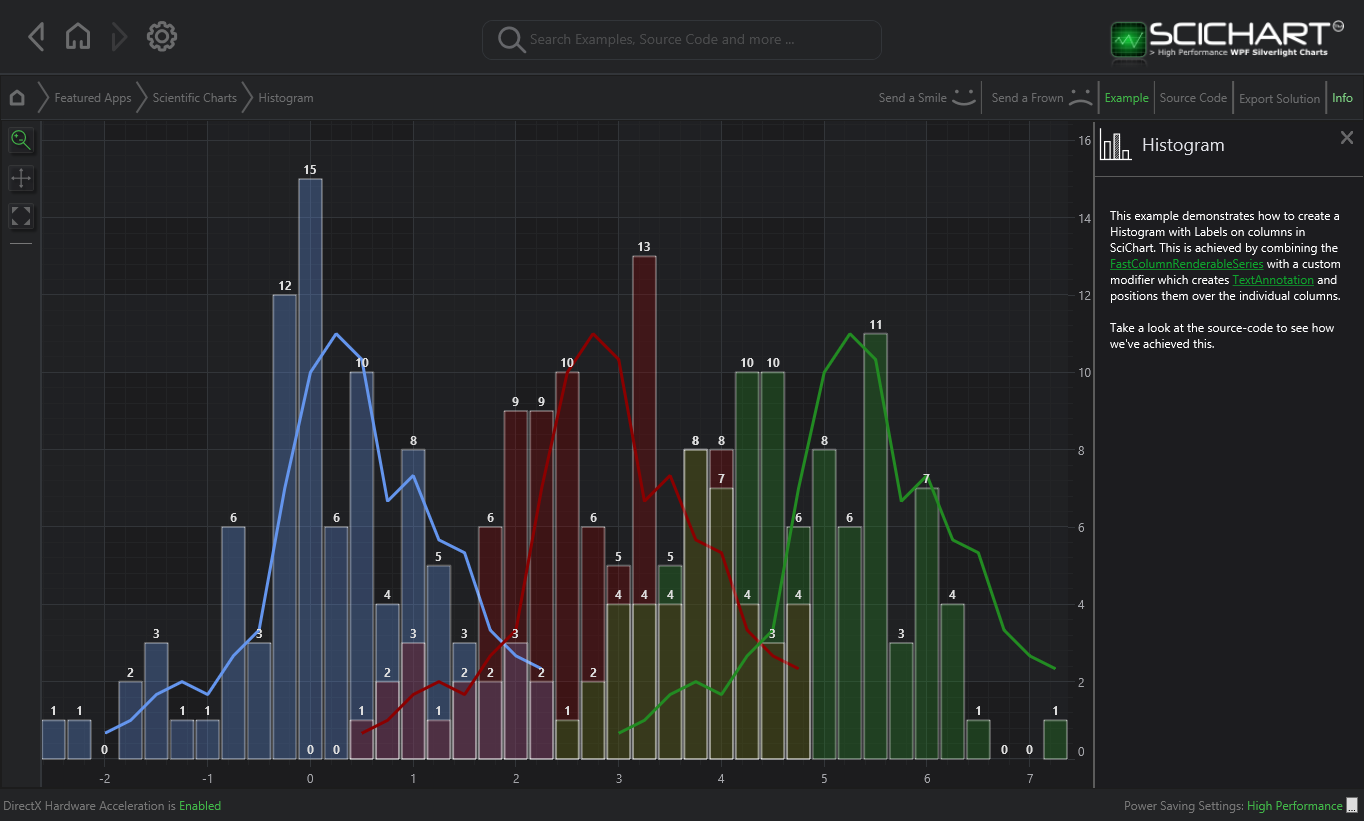
UPDATE: We now have an example included in the SciChart v4 Examples Suite.
You can find a link to the Histogram Example page here.

- Andrew Burnett-Thompson answered 8 years ago
- You must login to post comments
Hi there, and thanks for your enquiry!
It just so happens we have a sample for this already in our internal test-suite. Please see the attached.
What it does is append LabelAnnotations for the values on a Histogram plot. The solution is quite simple, it just uses this code to ensure label annotations are placed centred and above columns:
private void HistogramExampleView_Loaded(object sender, System.Windows.RoutedEventArgs e)
{
    var series = new XyDataSeries<double, double>();
    series.SeriesName = "Histogram";

    var yValues = new double[] { 0.0, 0.1, 0.2, 0.4, 0.8, 1.1, 1.5, 2.4, 4.6, 8.1, 11.7, 14.4, 16.0, 13.7, 10.1, 6.4, 3.5, 2.5, 1.4, 0.4, 0.1, 0.0, 0.0 };

    for (int i = 0; i < yValues.Length; i++ )
    {
        // DataSeries for appending data
        series.Append(i, yValues[i]);

        // Annotations for text labels
        var labelAnnotation = new TextAnnotation()
                                    {
                                        FontSize = 10,
                                        X1 = i,
                                        Y1 = yValues[i],
                                        Text = yValues[i].ToString(),
                                        Foreground = new SolidColorBrush(Color.FromArgb(0xFF,0x33,0x33,0x33)),
                                        FontWeight = FontWeights.Bold,
                                        VerticalAnchorPoint = VerticalAnchorPoint.Bottom,
                                        HorizontalAnchorPoint = HorizontalAnchorPoint.Center
                                    };

        this.sciChart.Annotations.Add(labelAnnotation);
    }

    columnSeries.DataSeries = series;
}
If you wanted to do something more complex, maybe dynamically place annotations based on changing data, then you could look at this post, which describes an architecture for managing and keeping track of annotations using custom chartmodifiers.
Andrew
- Andrew Burnett-Thompson answered 11 years ago
 What about in iOS? I need to do something similar (totals at the top of bar and stacked bar charts)?
- You must login to post comments
Please login first to submit.


