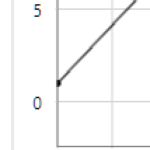
Notice in the image that the point marker is cut off by the graph border. Is there any way to allow it to extend past the border so in this case it would be a full circle? Thank you!
- AE Admin asked 7 years ago
- You must login to post comments
Hi Andy
I’m afraid SciChart’s rendering capabilities end at the border of the chart, so this isn’t possible.
The only thing you can do is to add some padding to the XAxis using this code:
<s:SciChartSurface.XAxis>
    <s:NumericAxis GrowBy="0.05, 0.05"/>
<s:/SciChartSurface.XAxis>
This will give 5% padding either side of the minimum, maximum X values and will allow edge points to be shown.
Best regards,
Andrew
- Andrew Burnett-Thompson answered 7 years ago
- You must login to post comments
Please login first to submit.

