Hello.
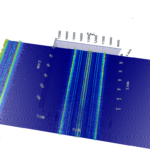
Is there a way to hide points out of the Visual Range in SciChart3DSurface?
Version
7
Images

- nada nada asked 1 year ago
- last edited 1 year ago
 I’m asking the team now if we can clip to bounds. If not, it might be possible to add to the library. Will get back to you soon. Very cool chart by the way! What chart type is it?
 I drew waterfall chart using PointLineRenderableSeries3D. Looking at your answer, I checked that the clip works fine in ScatterRanderableSeries3D, which was very good. But it still seems not to work in PointLineRanderableSeries3D. Is it possible to apply this function to PointLineRanderableSeries3D? Or is there a way to apply LineStrip option to ScatterRanderableSeries3D?
- You must login to post comments
Hi there
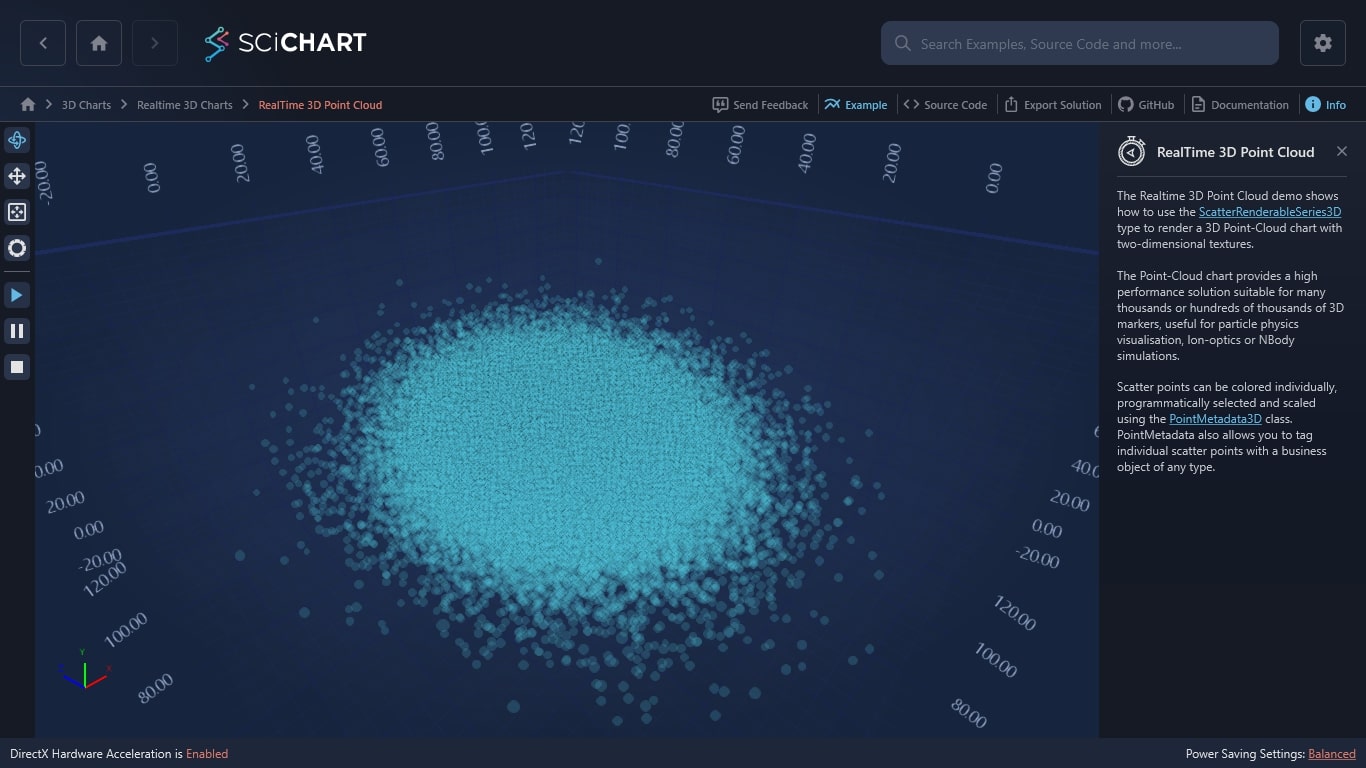
There is a property in AxisBase3D called PositiveSideClipping and NegativeSideClipping, This allows you to clip a specific axis to the world coordinates.
This is used in the WPF 3D Chart RealTime 3D Point Cloud Example which has a randomised point-cloud and hides the point as they ‘escape’ from the world cube.
Here’s the code from Github
    <s3D:SciChart3DSurface x:Name="sciChart" Grid.Column="1" WorldDimensions="200,100,200" BorderThickness="0">
         ...
        <s3D:SciChart3DSurface.XAxis>
            <s3D:NumericAxis3D GrowBy="0.1, 0.1" AutoRange="Once"/>
        </s3D:SciChart3DSurface.XAxis>

        <s3D:SciChart3DSurface.YAxis>
            <s3D:NumericAxis3D GrowBy="0.1, 0.1" AutoRange="Once"
                      NegativeSideClipping="VisibleRange"
                      PositiveSideClipping="VisibleRange" />
        </s3D:SciChart3DSurface.YAxis>

        <s3D:SciChart3DSurface.ZAxis>
            <s3D:NumericAxis3D GrowBy="0.1, 0.1" AutoRange="Once"/>
        </s3D:SciChart3DSurface.ZAxis>
    </s3D:SciChart3DSurface>
Let me know if this helps!
Best regards
Andrew
- Andrew Burnett-Thompson answered 1 year ago
- last edited 1 year ago
- You must login to post comments
Hi Andrew.
Thanks for your detailed guide.
With your help, I checked that it is applied in ScatterRanderableSeries3D.
However, in PointLineRenderableSeries3D, the area outside the VisibleRange still seems to be displayed. Any good ideas for this?
<s3D:SciChart3DSurface>
    <s3D:SciChart3DSurface.RenderableSeries>
        <s3D:PointLineRenderableSeries3D/>
    </s3D:SciChart3DSurface.RenderableSeries>
    <s3D:SciChart3DSurface.XAxis>
        <s3D:NumericAxis3D NegativeSideClipping="VisibleRange" PositiveSideClipping="VisibleRange"/>
    </s3D:SciChart3DSurface.XAxis>
    <s3D:SciChart3DSurface.YAxis>
        <s3D:NumericAxis3D VisibleRange="0,50" NegativeSideClipping="VisibleRange" PositiveSideClipping="VisibleRange"/>
    </s3D:SciChart3DSurface.YAxis>
    <s3D:SciChart3DSurface.ZAxis>
        <s3D:NumericAxis3D NegativeSideClipping="VisibleRange" PositiveSideClipping="VisibleRange"/>
    </s3D:SciChart3DSurface.ZAxis>
</s3D:SciChart3DSurface>
Images

- nada nada answered 1 year ago
- last edited 1 year ago
- Thanks for the additional information. I’ve recorded a bug to investigate – to find out why this isn’t being applied to PointLineRenderableSeries. Here’s the task ID https://abtsoftware.myjetbrains.com/youtrack/issue/SC-7181/
- You must login to post comments
Your Answer
Please login first to submit.
