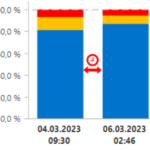
Hello support team,
I’m using a SciChartSurface Chart with a CategoryDateTimeAxis (xAxis).
The chart should contain three stacked bar columns and Annotations between the columns.
How can I place the Annotations exactly between the columns with consideration of the dynamic width of chart surface? I haven’t found the exactly property or solution for this particular case.
Thanks for your support in advanced!
- Miriam Moser asked 1 year ago
- You must login to post comments
Hi Miriam,
I’m not sure the requirement you want is possible with SciChart WPF.
Firstly, the CategoryAxis requires that x-Values on axis or annotations are set to an index of your data. In SciChart WPF this index is an integer or rounded to integer, meaning that annotation.X1 can only fall on whole round number (0, 1, 2, 3) and align with a data-point.
Secondly, there is no exposed API to get the available width between two columns.
However, if you switch to NumericAxis or DateTimeAxis then you could place an annotation between data-points. You could also estimate the gap between columns by using FastColumnRenderableSeries.DataPointWidth. The DataPointWidth is a fraction of available space occupied by a column. e.g. for a DateTimeAxis if two datapoints are 1 hour apart, and DataPointWidth = 0.7, then the gap between two columns will be equal to 2(1 - 0.7) = 0.6 hours
So try this. Try placing columns on a DateTimeAxis or NumericAxis, setting DataPointWidth = 0.7 then placing your Annotations half way between data-points with X1, X2 0.6 apart
Best regards
Andrew
- Andrew Burnett-Thompson answered 1 year ago
- last edited 1 year ago
- You must login to post comments
Please login first to submit.

