I have the following (attached) scatter chart, which contains normalized positions in an ellipse shape.
Since my chart isn’t squared the x-Axis stretches longer than the y-axis, even though they both range from 0-1.
Is there any way to “squash” down the x-axis so the data will be display in their true circle shape?

- Mario da Graca asked 2 years ago
 OK so you want the aspect ratio of the chart to be 1:1 no matter its size? or you want the size to be forced to be a square?
 I want the Aspect Ratio to be 1:1 no matter it’s size and still be able to zoom and pan around. But if you could write me both answers I would be very thankful.
- You must login to post comments
Hi Mario
A SciChartSurface is designed to fill the parent container, and to stretch to fit that parent container always.
So if you wanted to maintain a constant aspect ratio for the chart (ensure that XAxis spacing and YAxis Spacing has the same physical spacing no matter the window size), there are two choices:
1/ Place the SciChartSurface inside a parent container which has a uniform width.
2/ Manipulate the Axis VisibleRange to ensure constant aspect ratio
I’ve uploaded an example of (2) here.
How this works:
- It draws a circle to the chart using this formula
- Then it subscribes to Window.SizeChanged
- Finally it updates xAxis.VisibleRange to ensure a constant aspect ratio
The formula & code for updating xAxis.VisibleRange is this
private void Window_SizeChanged(object sender, SizeChangedEventArgs e)
{
    // The size of the viewport where series are drawn
    var size = new Size(this.sciChart.GridLinesPanel.Width, this.sciChart.GridLinesPanel.Height);

    var yRange = yAxis.VisibleRange.AsDoubleRange();
    var xRange = xAxis.VisibleRange.AsDoubleRange();

    // We want to normalize xAxis.visiblerange.max so that
    // (yRange.Max - yRange.Min) = (xRange.Max - xRange.Min)
    //        ------------------------                             -------------------------
    //              size.Height                                         size.Width

    var newXMax = (yRange.Max - yRange.Min) * size.Width / size.Height + xRange.Min;

    xAxis.VisibleRange = new DoubleRange(xRange.Min, newXMax);
}
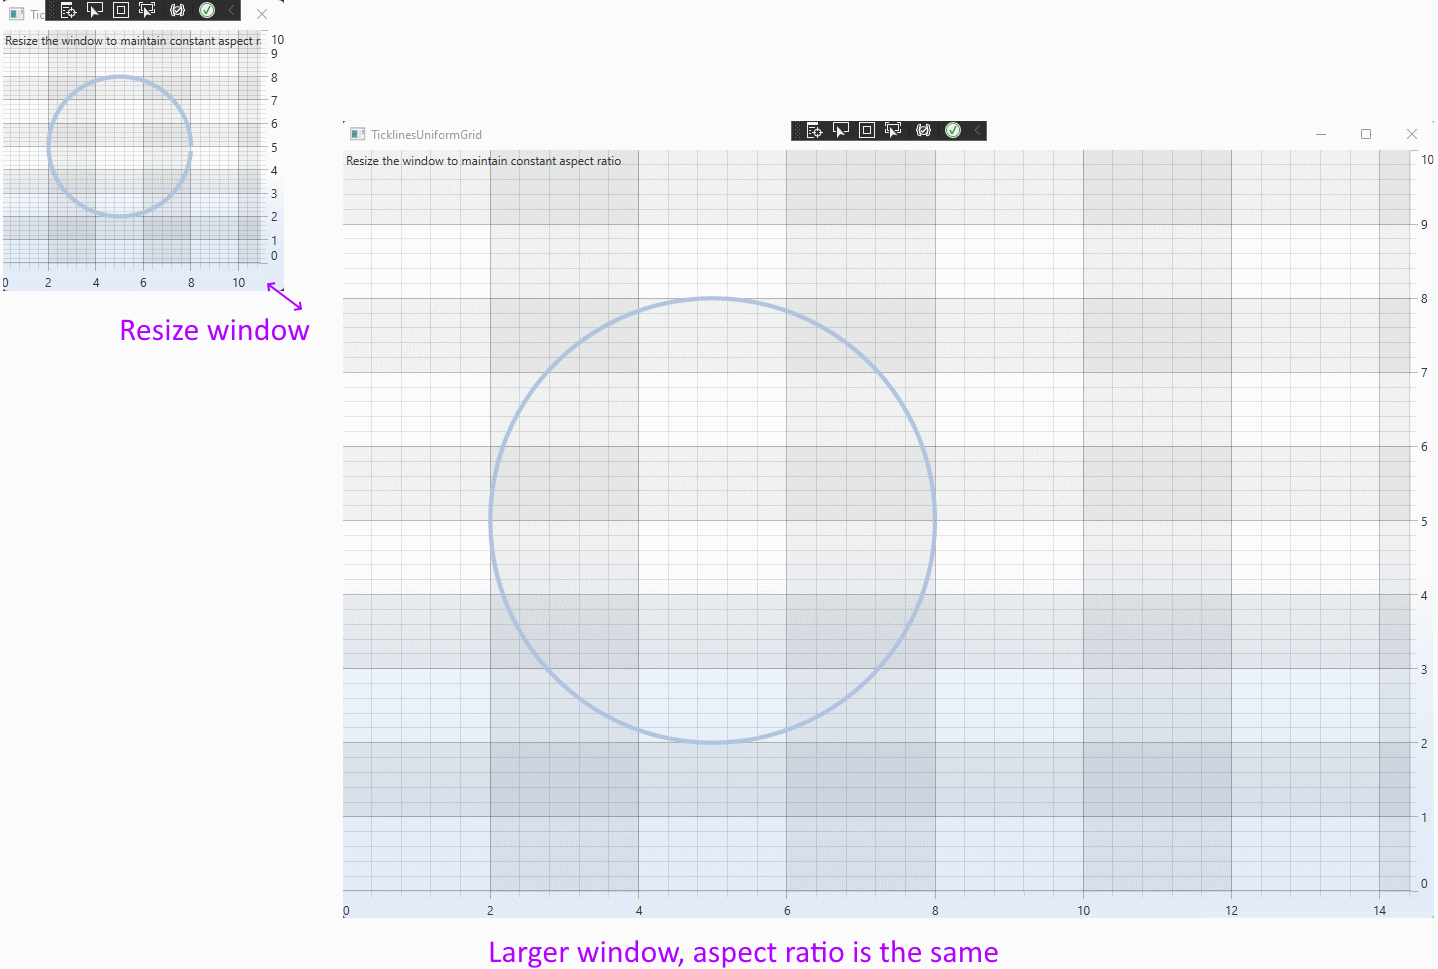
This results in the following output. The circle remains a circle no matter how the window is resized.
Best regards,
Andrew
- Andrew Burnett-Thompson answered 2 years ago
- last edited 2 years ago
- You must login to post comments
Thank you Andrew for your solution.
I got that working for me, but unfortunately the normalized visible range only applies after I manually change the size once.
Meaning, it doesn’t work after I initially load the data into the chart.
I was looking for a RenderableSeriesChanged event or something similar, to manually call the method once the data is loaded, but that doesn’t seem to exist. Since my application follows the mvvm pattern, I’m not able to set the Visible Range with these calculations in my viewmodel.
Is there a solution I’m not seeing?
Best regards,
Mario
- Mario da Graca answered 2 years ago
- Hi Mario, have you thought about writing an attached behaviour to do this? You need a class which has access to the scichartsurface, it’s axis, can listen to resized events and so on. Your initial question wasn’t very specific, just asked for normalising the x and y axis. If you can specify more precisely what you want, including how your code is set up now, we may be able to help
- You must login to post comments
Please login first to submit.
