Hi,
I need to implement a chart that looks pretty much like the attached one. The chart has the following requirements:
– the x-axis position is always at value 0.0
– the length (in pixel) the x-axis must always have the same length as the positive part of the y-axis
– the displayed data range on the y-axis must always be twice as much as on the x-axis (e.g 0-5 on x-axis means 0-10 on y-axis). So if the charts updates the visible range on the y-axis, the x-axis range must be updates as well and and vice versa.
I really don’t know if that’s even possible with Scichart? If yes could you please give me some initial help how to get this done?
Thx
Joerg

- Joerg Hoehn asked 11 years ago
- You must login to post comments
Hi there,
As of v3.2, centre axis is now supported natively in v3.2, soon to be released. Please see our article on What’s New in SciChart v3.2.
Please see Creating a Chart with Center Axis article.
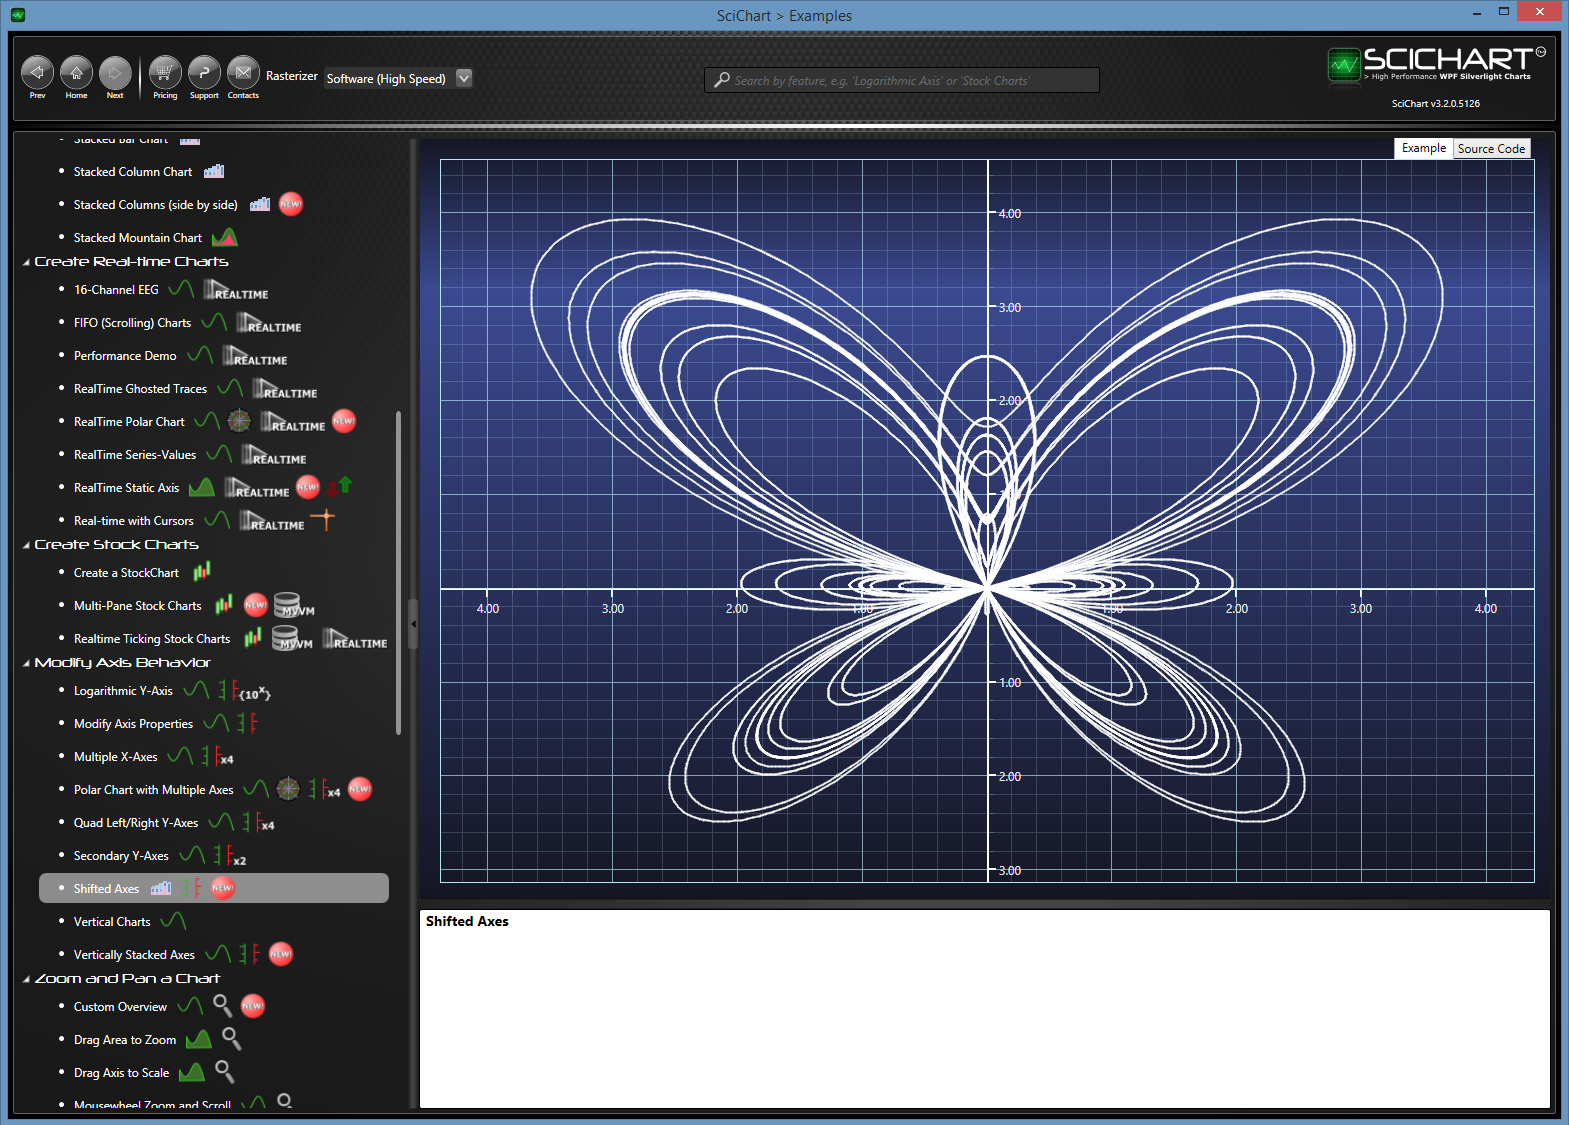
The Shifted-Axis sample shows how to template the CentreAxisPanel and move axes to the centre of the screen.
Let us know your feedback!
Best regards,
Andrew
- Andrew Burnett-Thompson answered 10 years ago
- last edited 10 years ago
- You must login to post comments
Hello Joerg,
I tried to implement shifted X axis, and modified our BandSeries chart example a bit. Please, find the screenshot below. And here is a code:
public class SciChartSurfaceWithShiftedXAxis: SciChartSurface
    {
        public SciChartSurfaceWithShiftedXAxis()
        {
            Rendered += OnSurfaceRendered;
        }

        private void OnSurfaceRendered(object sender, EventArgs e)
        {
            var xAxis = XAxis as AxisBase;

            var xAxisArea = GetAndAssertTemplateChild<AxisArea>("PART_BottomXAxisArea");
            if(xAxisArea.Children.Contains(xAxis))
            {
                xAxisArea.Children.Remove(xAxis);

                ModifierSurface.Children.Add(xAxis);
            }

            var yCoordCalc = YAxis.GetCurrentCoordinateCalculator();
            if(yCoordCalc != null)
            {
                var xAxisPos = yCoordCalc.GetCoordinate(0d);

                Canvas.SetTop(xAxis, xAxisPos);
            }
        }
    }
And markup:
<UserControl x:Class="Abt.Controls.SciChart.Example.Examples.IWantTo.CreateSimpleChart.BandSeriesChartExampleView"
             xmlns=" http://schemas.microsoft.com/winfx/2006/xaml/presentation"
             xmlns:x=" http://schemas.microsoft.com/winfx/2006/xaml"
             xmlns:CreateSimpleChart="clr-namespace:Abt.Controls.SciChart.Example.Examples.IWantTo.CreateSimpleChart"
             xmlns:d=" http://schemas.microsoft.com/expression/blend/2008"
             xmlns:mc=" http://schemas.openxmlformats.org/markup-compatibility/2006"
             xmlns:SciChart=" http://schemas.abtsoftware.co.uk/scichart"
             d:DesignHeight="300"
             d:DesignWidth="300"
             Loaded="BandSeriesChartExampleView_OnLoaded"
             mc:Ignorable="d">
    <UserControl.Resources>

        <Style x:Key="MajorTickLineStyle" TargetType="Line">
            <Setter Property="Stroke" Value="DarkGray" />
            <Setter Property="StrokeThickness" Value="2" />
            <Setter Property="X2" Value="6" />
            <Setter Property="Y2" Value="6" />
        </Style>

        <Style x:Key="MinorTickLineStyle" TargetType="Line">
            <Setter Property="Stroke" Value="DarkGray" />
            <Setter Property="StrokeThickness" Value="2" />
            <Setter Property="X2" Value="3" />
            <Setter Property="Y2" Value="3" />
        </Style>

    </UserControl.Resources>

    <!--  Create the chart surface  -->
    <CreateSimpleChart:SciChartSurfaceWithShiftedXAxis x:Name="sciChart" SciChart:ThemeManager.Theme="BlackSteel">

        <!--  Declare RenderableSeries  -->
        <CreateSimpleChart:SciChartSurfaceWithShiftedXAxis.RenderableSeries>
            <SciChart:FastBandRenderableSeries BandDownColor="#33279B27"
                                               BandUpColor="#33FF1919"
                                               IsDigitalLine="False"
                                               Series1Color="#FF279B27"
                                               SeriesColor="#FFFF1919">
                <SciChart:FastBandRenderableSeries.RolloverMarkerTemplate>
                    <ControlTemplate>
                        <Ellipse Width="7"
                                 Height="7"
                                 Fill="Transparent"
                                 Stroke="#CCFF6600" />
                    </ControlTemplate>
                </SciChart:FastBandRenderableSeries.RolloverMarkerTemplate>
            </SciChart:FastBandRenderableSeries>
        </CreateSimpleChart:SciChartSurfaceWithShiftedXAxis.RenderableSeries>

        <!--  Create an X Axis  -->
        <CreateSimpleChart:SciChartSurfaceWithShiftedXAxis.XAxis>
            <SciChart:NumericAxis Width="{Binding ActualWidth,
                                                  RelativeSource={RelativeSource AncestorType=CreateSimpleChart:SciChartSurfaceWithShiftedXAxis}}"
                                  BorderBrush="DarkGray"
                                  BorderThickness="0,2,0,0"
                                  MajorTickLineStyle="{StaticResource MajorTickLineStyle}"
                                  MinorTickLineStyle="{StaticResource MinorTickLineStyle}" />
        </CreateSimpleChart:SciChartSurfaceWithShiftedXAxis.XAxis>

        <!--  Create a Y Axis with GrowBy  -->
        <CreateSimpleChart:SciChartSurfaceWithShiftedXAxis.YAxis>
            <SciChart:NumericAxis AxisAlignment="Left"
                                  BorderBrush="DarkGray"
                                  BorderThickness="0,0,2,0"
                                  MajorTickLineStyle="{StaticResource MajorTickLineStyle}"
                                  MinorTickLineStyle="{StaticResource MinorTickLineStyle}">
                <SciChart:NumericAxis.GrowBy>
                    <SciChart:DoubleRange Max="0.1" Min="0.1" />
                </SciChart:NumericAxis.GrowBy>
            </SciChart:NumericAxis>
        </CreateSimpleChart:SciChartSurfaceWithShiftedXAxis.YAxis>

        <CreateSimpleChart:SciChartSurfaceWithShiftedXAxis.ChartModifier>
            <SciChart:ModifierGroup>
                <!--  <SciChart:RolloverModifier/>  -->
                <SciChart:RubberBandXyZoomModifier ReceiveHandledEvents="True" />
                <SciChart:ZoomExtentsModifier />
                <SciChart:ZoomPanModifier ExecuteOn="MouseRightButton" />
                <SciChart:CursorModifier ShowAxisLabels="True" />
                <SciChart:MouseWheelZoomModifier />
            </SciChart:ModifierGroup>
        </CreateSimpleChart:SciChartSurfaceWithShiftedXAxis.ChartModifier>

    </CreateSimpleChart:SciChartSurfaceWithShiftedXAxis>

</UserControl>
Regarding chart size/visibleRange requirements, you could simple manage them in ViewModel, or using ViewportManager(see this post dedicated to ViewportManager usage).
Does this make sense for you? Please, feel free to ask if you need further assistance.
Best regards,
Yuriy

- Yuriy Zadereckiy answered 11 years ago
 Hi Yuriy, I tried to implement your solution to a small MVVM example, but I don't get it done. Please can you have a look on it, and help me to get it work? Thx Joerg
- Hi, Thanks so far, it works! :-D Now I'm trying to use the ViewportManager to implement the other requirements.
 Update: Due to control template changes, this workaround no longer works in SciChart v3.0 and above. We are working on an alternative by adding axis placement natively to SciChart v3.2
 is there any other workaround we can use until 3.2?
- You must login to post comments
Please login first to submit.
