When running with scaling other than 100%, the results are very blurry.
I’ve come across this article https://support.scichart.com/index.php?/Knowledgebase/Article/View/17263/40/ which explains the reasoning. In that you’re always rendering at 96DPI no matter what the current scaling is set to.
It says to use the XamlRenderSurface, but this isn’t practical in most scenarios. For example, we want to render scatter plots. Enabling the XamlRenderSurface in your Scatter Chart example results in very poor performance even with only a small number of points being rendered.
So is the situation still the same from that 2019 article? You still don’t provide the option to render using the accelerated surface at anything other than 96 DPI?
I appreciate that the performance would be reduced, but it would surely be much better than the XamlRenderSurface?
- Ben Green asked 8 months ago
- You must login to post comments
Hi Ben,
Thanks for your inquiry.
As Andrew mentioned above, we have a workaround that may suit your requirements. The idea is to scale down a SciChart chart using WPF ScaleTransform.
One way in which this can be achieved is creating a custom SciChartSurface and applying a scaling transform once display scaling changes. Please find a couple of screenshots that shows the difference between a regular SciChartSurface and the extended one attached.
This approach is demonstrated in the “DPI_Aware_SciChartSurface” example that can be found in our Sandbox on SciChart GitHub. You can find it at this link.
Please try this solution and let me know if it fits your requirements,
Best Regards,
Joeri
- Joeri R answered 7 months ago
 Hi Joeri, I’ve just tested this and it seems to work for the chart rendering, but not the Axes or the Annotations. I’ll post an answer with screenshots below
 Noted: I did say to Joeri & WPF team yesterday, this scales the series but but not the font sizes or series strokes (all should scale for a true DPI aware solution)
- Thank you Andrew, does this mean you’re still working on a full solution then?
- We’re seeing what we can do quickly, however a full solution would require quite a deep refactor as I mentioned before. If there are fast workarounds we can employ then we will share them.
- You must login to post comments
Hi Ben,
Thanks for your inquiry.
The article you are referring to is pretty outdated. This issue was fixed a long time ago and we haven’t received such reports since then.
You should have a clean and smooth picture with the latest SciChart version.
Please make sure you use the latest GPU drivers as well as the Windows version.
If all is up to date, please share the hardware details of your machine, some screenshots showing the issue, and a small sample project reproducing this behavior for investigation on our side.
Thanks in advance.
With best regards,
Lex
SciChart Technical Support Engineer
- Lex answered 8 months ago
- Any update on this?
- It would be good to get a response to the info you asked for please.
- Hi Ben, I prompted the team this morning, will remind them.
- You must login to post comments
Just to be clear, are you saying that I should be able to run SciChart using a scale higher than 100% (e.g 150, 175) with the default visual accelerator engine (not xaml rendering as that is far too slow) and it should render sharply?
If so, that doesn’t seem to be the case.
I can reproduce the issue in both a custom application and in your example browser on several different machines.
I have attached two images. The first is at 100% where both the chart content and text is nice and sharp. The second is at 200% where the content of the chart is blurry, but the text is nice and sharp.
The images don’t really capture the issue properly as they get scaled down when you view them at your normal scaling.
In both examples I have restarted the browser after making the scaling change.
EDIT : I’ve had to attach these as zip files as it seems that when you upload an image it applies a load of compression.

- Ben Green answered 8 months ago
- last edited 8 months ago
- You must login to post comments
In regards to the DpiAware_SciChartSurface demo, as mentioned in the comment above, it seems to work for the chart itself, but not the Axes or the annotations, which render at the wrong scale.
<Grid>
<Grid.ColumnDefinitions>
    <ColumnDefinition Width="Auto" />
    <ColumnDefinition Width="*" />
</Grid.ColumnDefinitions>

<ext:SciChartInteractionToolbar TargetSurface="{Binding Source={x:Reference Name=sciChart}}" />

<!-- Please notice that DpiAwareSciChartSurface requires a default style -->
<!-- It is declared above in UserControl.Resources -->
<sciChartScatterChart:DpiAwareSciChartSurface x:Name="sciChart"
                                              Grid.Column="1"
                                              Padding="0"
                                              BorderThickness="0"
                                              ShowLicensingWarnings="False">
    <s:SciChartSurface.Annotations>
        <s:TextAnnotation Text="Hello world! Annotation"
                          FontSize="14"
                          X1="5.0"
                          Y1="5" />
    </s:SciChartSurface.Annotations>
</sciChartScatterChart:DpiAwareSciChartSurface>

<TextBlock Text="Hello World! WPF"
           Foreground="White"
           FontSize="14"
           Grid.ColumnSpan="2"
           VerticalAlignment="Center"
           HorizontalAlignment="Center" />

- Ben Green answered 7 months ago
- last edited 7 months ago
- You must login to post comments
Hi Ben,
I’ve discussed this with the team today, for the benefit of the community I’ve attached a couple of screenshots showing SciChart WPF v7 at 200% DPI:
Bear in mind – view these images at 1:1 because they are very large and scaling in the browser will introduce extra blurring / scaling
issues.
I have changed the theme to light to make it clearer the effect on gridlines and pasted a 2x window of the series and text over the chart so you can see the difference. I also put a stroke around the scatter points so you can see the defined edge more clearly.
In my opinion these images are OK. They could be better but the lines, text are clear, do scale with DPI and have high enough quality to be readable.
However, there is room for improvement.
SciChart WPF at it’s core uses DirectX and textures (raster technology) not vector to draw, so at 1.5x scale we are rendering to a texture which is say 1.5x and scaling it down. As a result you’re never going to get pixel perfect images at DPI other than 100% because there’s no such thing as 1/2 a pixel on the monitor.
What you see in WPF is ‘as good as it gets’ at the moment. There may be some additional workarounds that we can apply to get the image sharper.
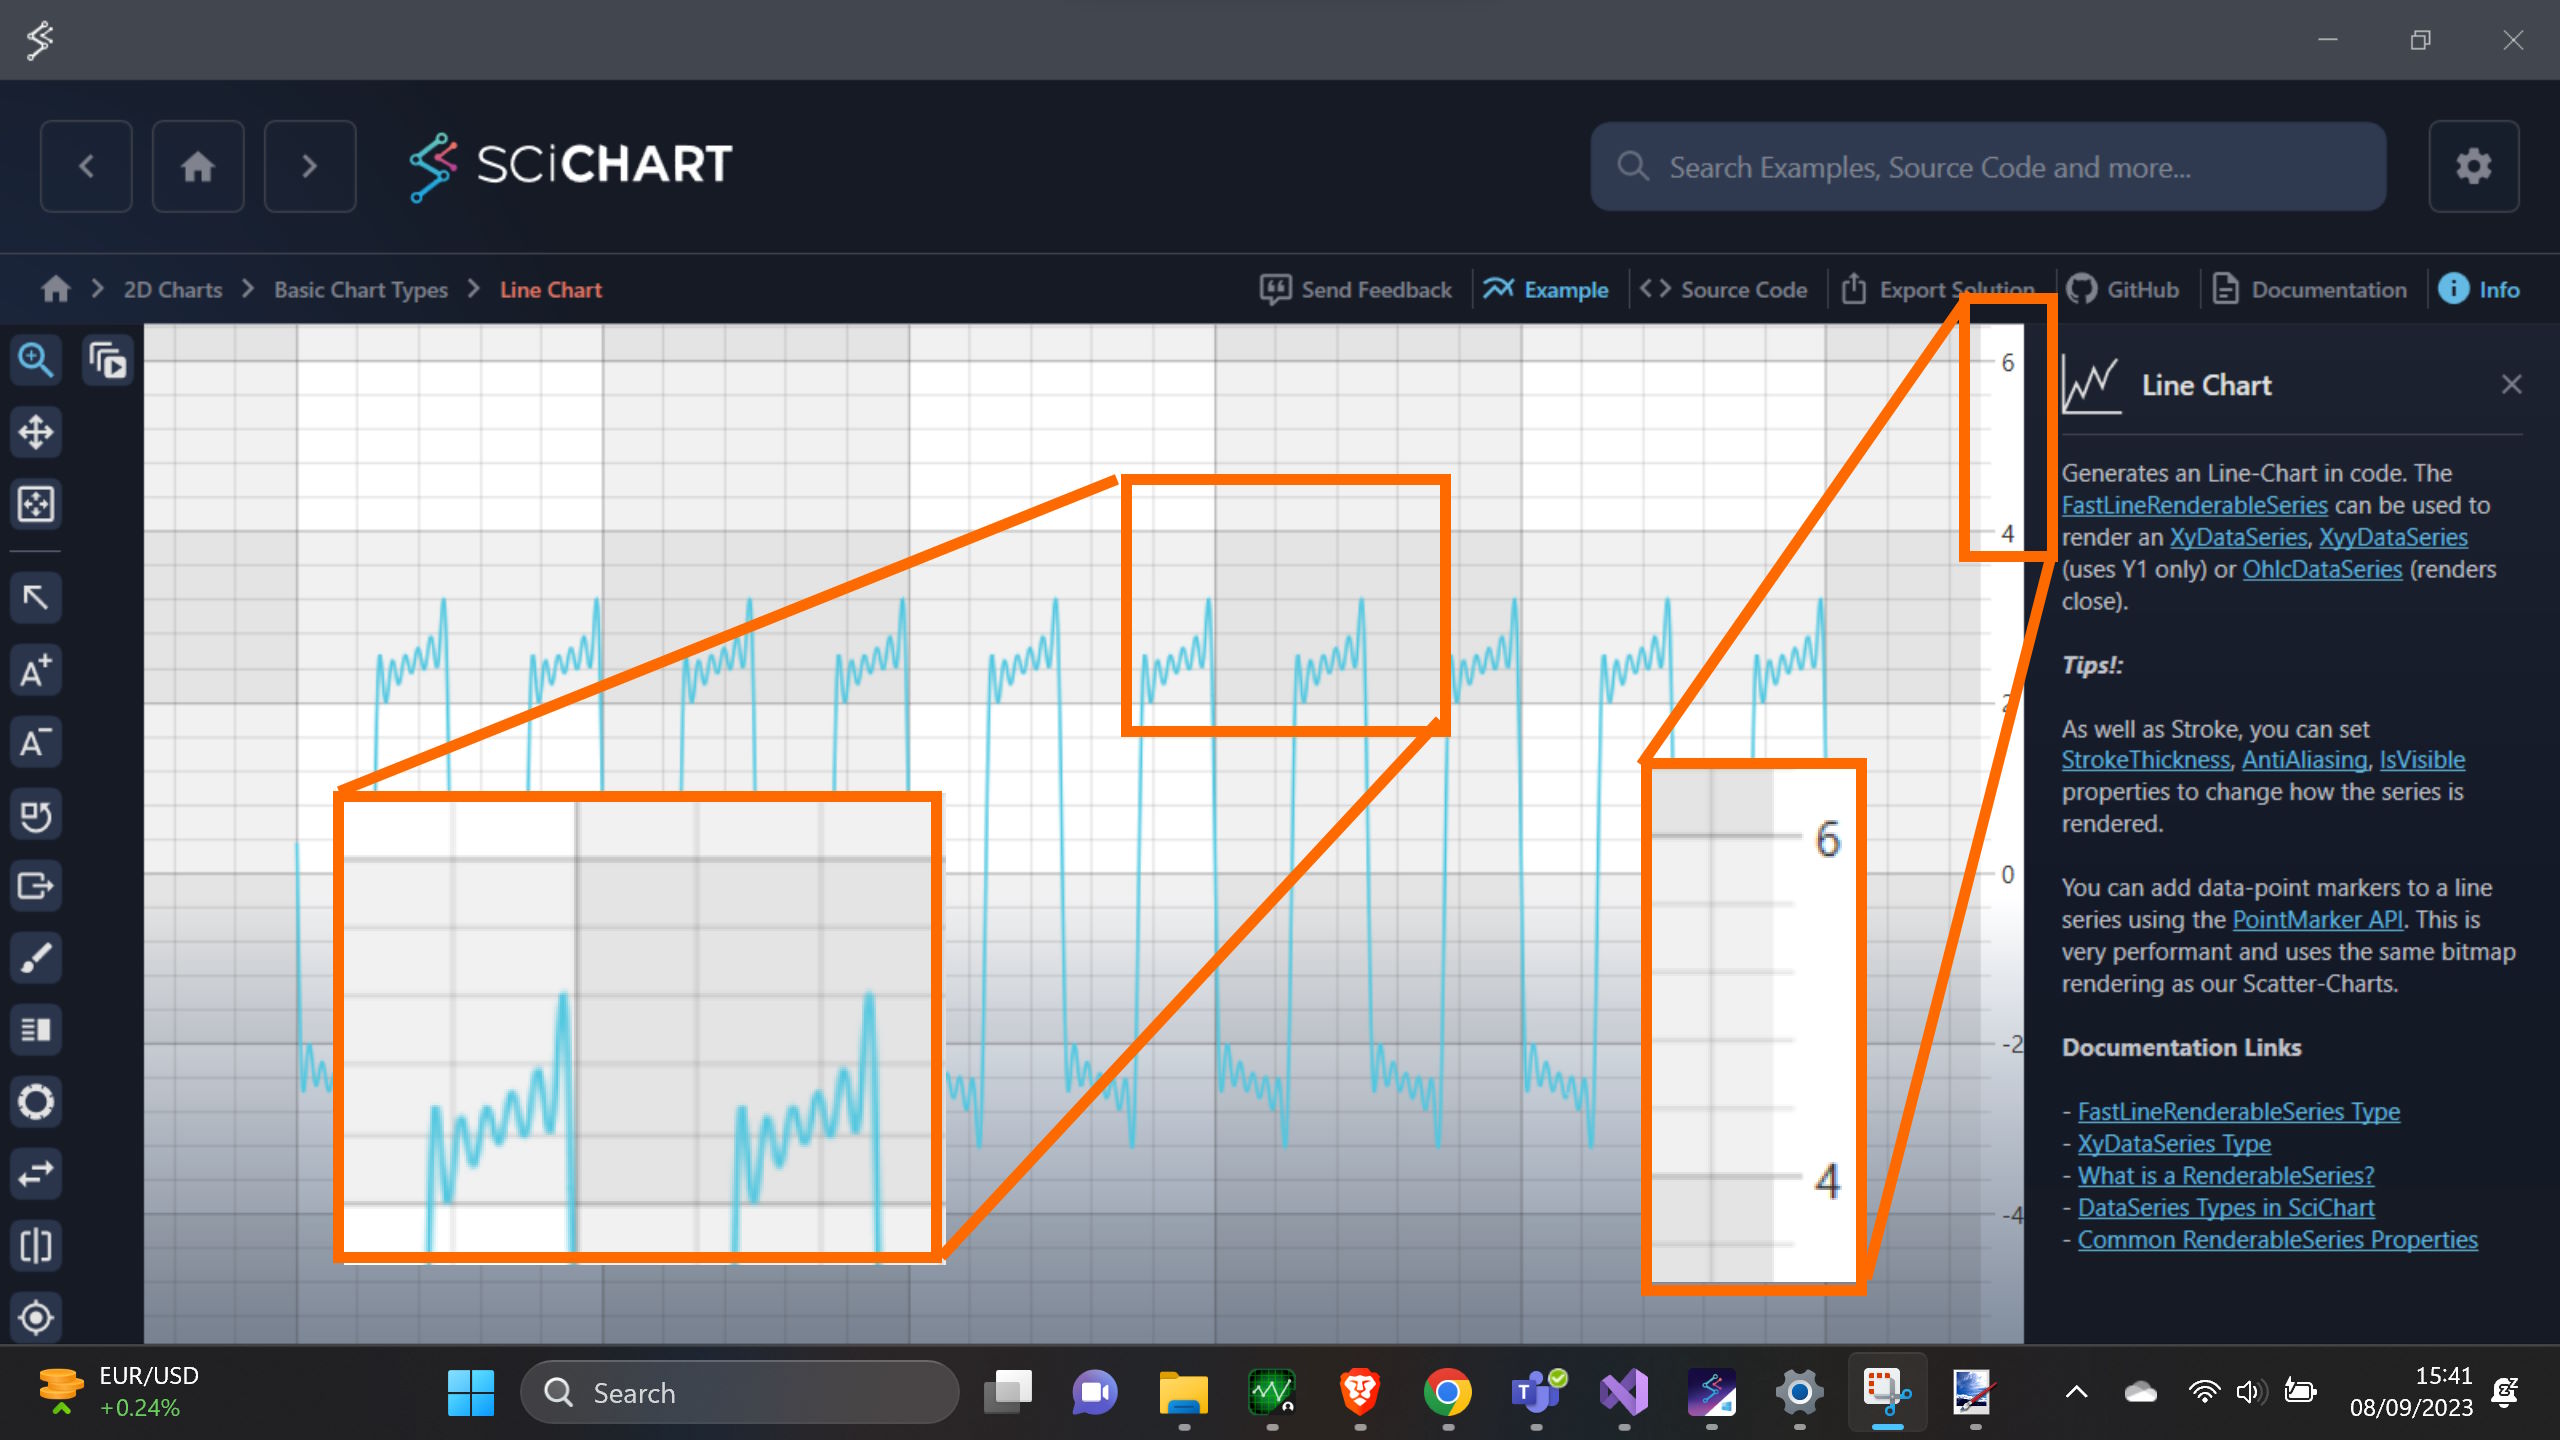
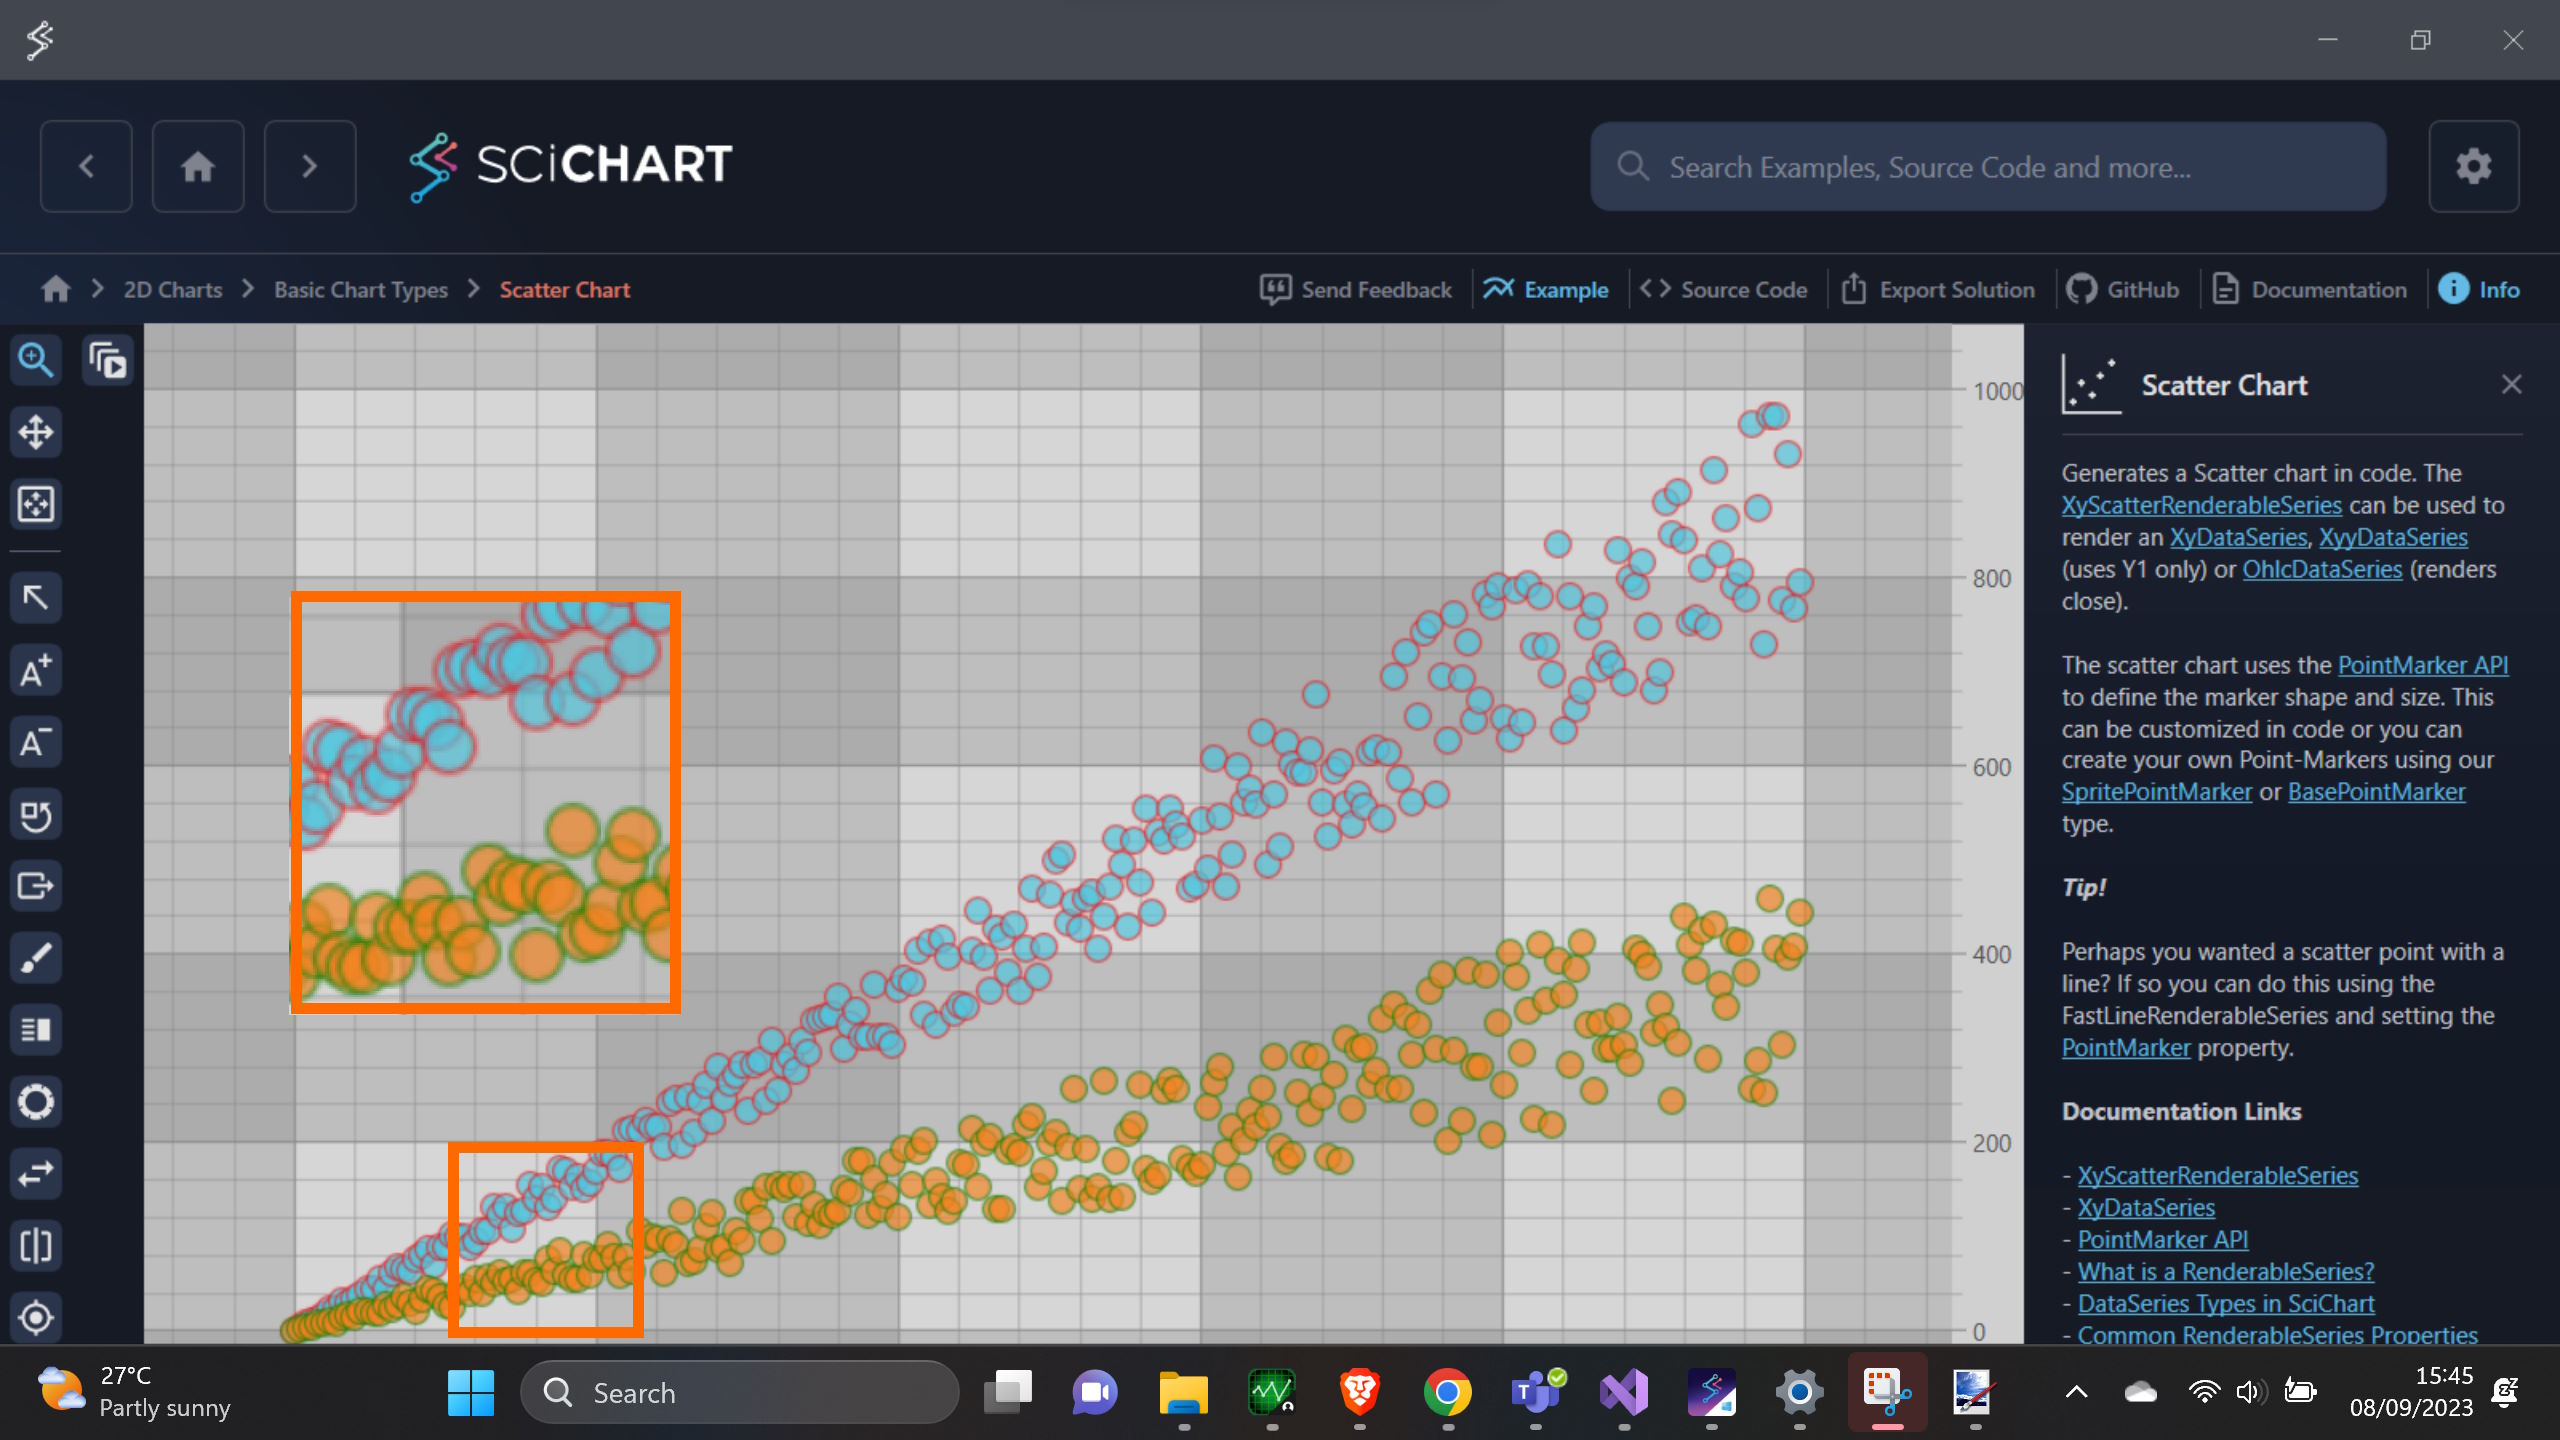
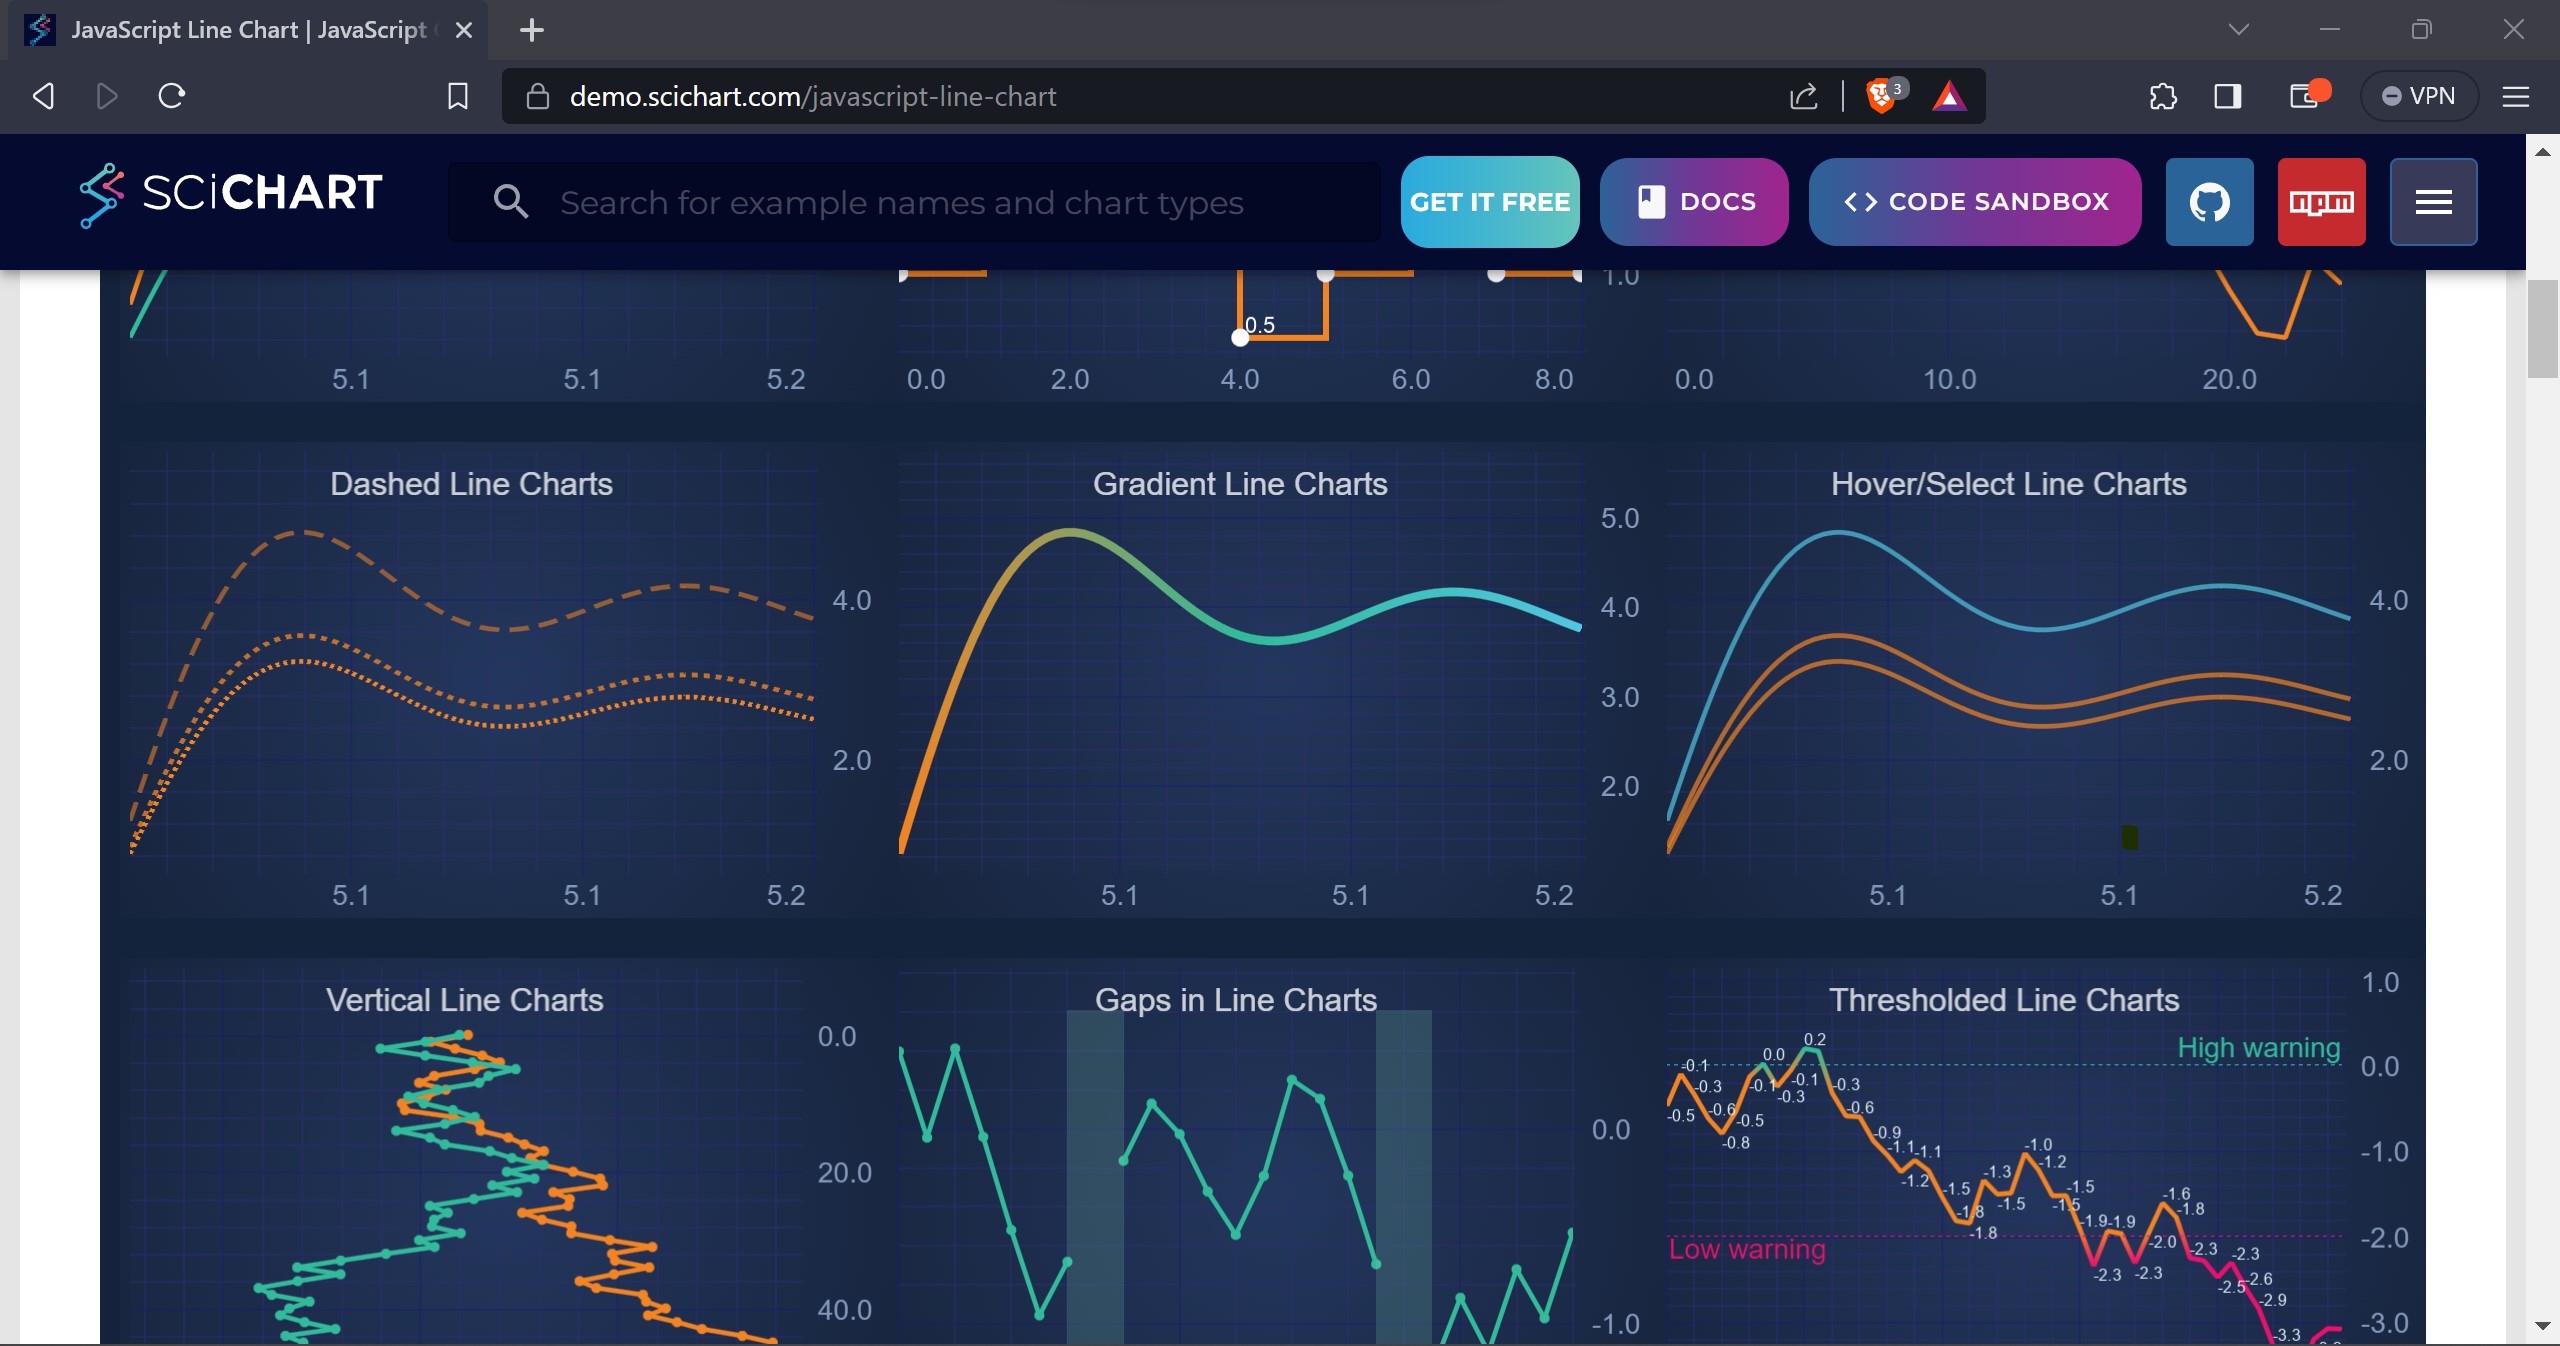
We are also able to achieve sharper imagery on our JavaScript charts using a different technique. Take a look at https://demo.scichart.com/javascript-scatter-chart and https://demo.scichart.com/javascript-line-chart
At 200% DPI these look fantastic, take a look at below:
Now to achieve the same thing in WPF we have to do quite a big deep refactor of the layout & rendering in SciChart WPF. It can be done (without sacrificing performance) but not something we can deliver immediately.
I’m going to discuss further with the WPF team and across our organisation to see what we can do – as we would like to improve this, but no promises on timing just yet
Best regards
Andrew
- Andrew Burnett-Thompson answered 8 months ago
- last edited 8 months ago
- Hi Andrew, you say at 150% you’re rendering at 1.5x and then scaling it down? Are you sure? to me it looks like it’s doing the opposite. So at 150%, it’s actually still rendering at 1x to the raster backbuffer and scaling up (stretching a smaller backbuffer to cover a larger screen area), hence the results looking blurry? If it was the other way around, you’d get more of an aliasing effect, not a blurry effect. So I’m still not convinced that it is actually scaling with DPI at all. These days more and more people will be using a scale higher than 100%, as screen resolutions get higher whilst being the same physical size. The problem is made more evident when using annotations, as the annotations are vector, yet the chart itself is raster. So you get nice sharp annotations (and text), and then a blurry result for everything else. So I really do think this needs fixing.
- Yes, I agree, see my post above – we have done a different technique on JS so we know how to do this, but it’s a deep refactor and may introduce breaking changes. The WPF team also has a workaround for you which we’re going to post next week. Have a good weekend, Andrew
- You must login to post comments
Please login first to submit.
