Hi;
If I remember good, in a old version of SciChart it was possible to draw custom annotation in chart with a “pen”, like in Paint.
In the current version is it possible? And if yes, how do it please?
Regards;
Damien
Version
4
- Damien Soudant asked 7 years ago
- You must login to post comments

I think you remember wrong, however, it should be possible to do using our RenderContext2D API and a custom ChartModifierBase derived class.
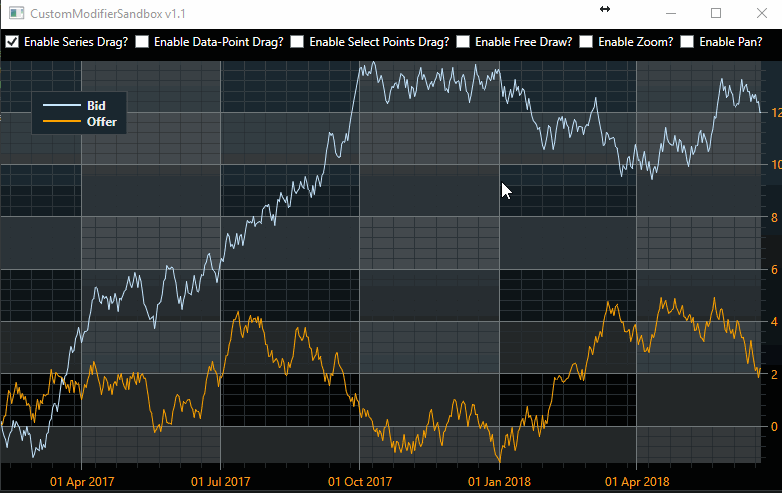
We have an example which allows you to free draw a Line Series which I’ve uploaded to a Github repo here.
 .
.
Take a look at that. This draws using a DataSeries however you could just as easily draw on Mouse Move and create multiple series for your free text. The text will zoom and pan as you zoom and pan the chart.
Best regards,
Andrew
- Andrew Burnett-Thompson answered 7 years ago
- You must login to post comments
Your Answer
Please login first to submit.
