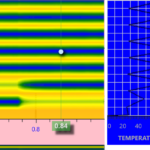
I have two SciChartSurfaces
One is a HeatMap (x:Name=”MainChartSurface”), the other a line graph.
I have set it up so that when a vertical cursor is moved the smaller line graph shows a ‘cross-section’ of the heatmap.
The attached image shows the right hand end of the heatmap and the smaller line graph.
The X-axis of the line graph is set to Alignment=Right and this axis has the same range as the y-axis of the heat map – set in xml as:
 MajorDelta="{Binding Source={x:Reference Name=MainChartSurface}, Path=YAxis.MajorDelta, Mode=TwoWay}"
 MinorDelta="{Binding Source={x:Reference Name=MainChartSurface}, Path=YAxis.MinorDelta, Mode=TwoWay}"
 AutoTicks="False"
 VisibleRange="{Binding Source={x:Reference Name=MainChartSurface}, Path=YAxis.VisibleRange, Mode=TwoWay}"
this all works, so if the main graph is zoomed, the 2D line graph Y-axis follows the main graph.
The Y-axis of the line graph has Alignment=Bottom, and it shows the z-values for all y-values at the location vertical cursor (a RolloverModifier) on the main graph.
The problem I have is that the space taken by the axis at the bottom of the charts is different, so the chart areas are different. Look carefully at the attached image and see the bottom axes do not align.
How can I link the space taken to force the bottom axes to stay in alignment?
Thanks
Andrew Milford
- Andrew Milford asked 8 months ago
 PS – Ignore the stripy bit at the bottom of the image, that is another SciChartSurface for zoom. The pink and blue backgrounds show the extent of the space for the two SciChartSurfaces in question here.
 Hi Andrew, Thanks for your inquiry. I am going to discuss it with our team and will get back to you as soon as I have an update. With best regards, Lex, SciChart Technical Support Engineer
- You must login to post comments
Hi Andrew,
We discussed your inquiry.
Our Axes are standard WPF controls having Width and Height properties.
Thus you can bind the Width properties of the two Axes you’ve mentioned.
Please try this out and let us know if it helps.
With best regards,
Lex,
SciChart Technical Support Engineer
- Lex answered 8 months ago
- You must login to post comments
I tried adding this to the definition of the y-axis on the right hand graph
Height="{Binding ActualHeight, ElementName=primaryXAxis, Mode=OneWay}"
the full definition is:
    <s:SciChartSurface.YAxis  >
        <s:NumericAxis x:Name="sectionYAxis"
            BorderBrush="Black" BorderThickness="0,1,0,0"
            DrawMajorBands="False" FlipCoordinates="True"
            MajorGridLineStyle="{StaticResource MajorGridLineStyle}"
            DrawMinorGridLines="False" DrawMajorGridLines="True" AxisAlignment="Bottom"
            AxisTitle="{Binding SectionXAxisTitle}"
            Height="{Binding ActualHeight, ElementName=primaryXAxis, Mode=OneWay}"
           >
        </s:NumericAxis>
    </s:SciChartSurface.YAxis>
but it did not work. There was no change.
(primaryXAxis is the name of the XAxis on the left hand chart)
In the end, in code-behind I used
sectionYAxis.Height = primaryXAxis.ActualHeight;
at the point where the right-hand section graph is populated and this worked. Pity it didn’t work in xaml binding but issue is resolved. Thanks.
- Andrew Milford answered 8 months ago
- You must login to post comments
Please login first to submit.

