I’m creating the series for a stacked column chart like so:
string[] categories = new string[] { "0-10", ">10-20", ">20-30", ">30-40", ">40-50", ">50-60", ">60-70" };
                    foreach (string category in categories)
                    {
                        i++;
                        Color _color = GetRandomColor(i);

                        var tempSeries = new XyDataSeries<double, double> { SeriesName = category };
                        FillDataSeries(ref tempSeries, category);

                        if (tempSeries == null) continue;

                        var tempRenderSeries = new StackedColumnRenderableSeries
                        {
                            DataSeries = tempSeries,
                            FillBrush = new SolidColorBrush(_color),
                            StackedGroupId = "currents"
                        };

                        // Add the new RenderableSeries
                        sciChart.RenderableSeries.Add(tempRenderSeries);
                    }

                    sciChart.ZoomExtents();

                    i++;
                }
The FillDataSeries method will populate the series from a .net DataSet object. The X axis contains numeric values that represent grouped direction categories and the Y axis contains numeric values representing the percentage of records for each category. The series are speed ranges.
However, my chart results in gaps in the columns.
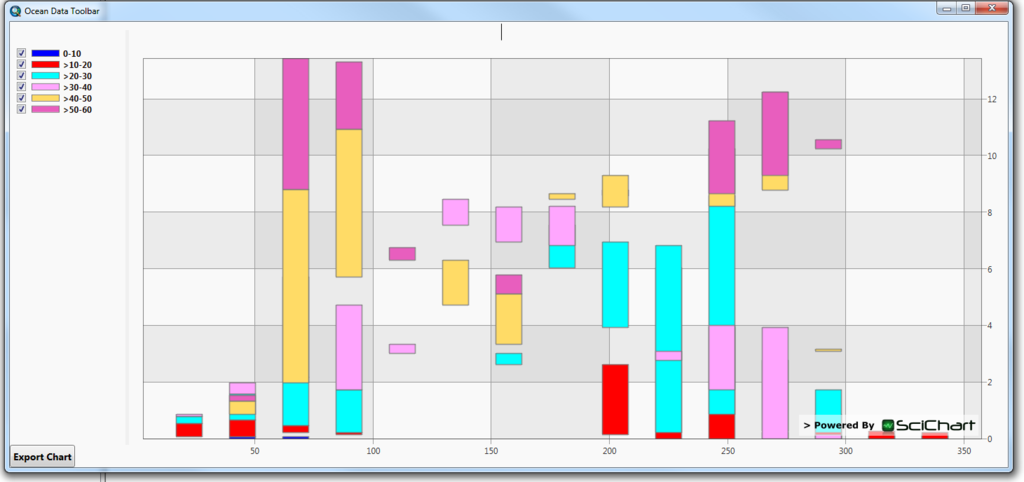
I’m not sure what causes this? Do the Series need to be zero filled for categories that have no records?
- wawr asked 9 years ago
- You must login to post comments
Hi there,
Thanks for your question. Generally speaking, SciChart requires that all series have the same set of XValues. Of course, series will be drawn even if they don’t have, but in this case you will lose some functionality such as Rollover and stacked series.
If a series doesn’t have value at a certain point (you need a gap at this point), there is a special value reserved for such cases. You should just put double.NaN as Y value at that point.
So in your case, you should ensure that all the series have the same XValues and append double.NaNs as Y values where you want to skip a point.
Please try it out and let us know if it works,
Best regards,
Yuriy
- Guest answered 9 years ago
 Thanks, I got it working by appending zero values in the Y column since it represents percentage values.
- You must login to post comments
Please login first to submit.
