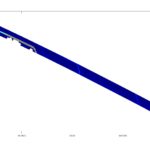
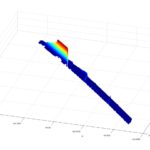
X, Z, Y are 2D (m x n) arrays of the same size.
How do I plot this as a 3D Surface mesh or a 2D Contour? I created a XyzDataSeries3D but when I set it to a SurfaceMeshRenderableSeries3D, it does not plot anything. But it does plot when using ScatterRenderableSeries3D.
I am basically trying to replicate the surf(X, Y, Z), contour(X, Y, Z) function in Matlab.
Attached is a test data that contain the X, Z and Y 2D arrays of size (261 x 10). The zip file contains an Excel file which has three sheets X, Z and Y that contain the data.
The images are of the Surf plot, and the Contour plot generated using Matlab. I need to generate these plots using SciChart instead of with Matlab.
- A Devadas asked 2 years ago
- last edited 2 years ago
- You must login to post comments
Please login first to submit.


