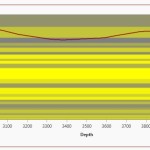
In the oil industry a well survey is usually displayed by a series of points connected by arcs. An arc is very close to the actual path a drill will take between points on a survey. Survey points are about 90 feet apart, so connecting them with a straight line looks ugly. Which method should I override to accomplish this?
If I get ambitious, I may also consider using Bezier curves to connect points, as this could be useful to represent geological boundaries as a background for my well survey plots.
I have attached a picture showing the type of plots I need to make. The red line is a survey and the background represents geological layers. The survey is presently connected with straight lines, which makes it difficult to determine precisely where the survey intercept the boundaries.
- Stephen Painchaud asked 9 years ago
- You must login to post comments
Hi Stephen,
While it is impossible to draw splines, bezier curves or arcs with SciChart out of the box, we do have a very well documented workaround on creating a Spline series using our CustomRenderableSeries API.
Take a look at the following KB article Creating a Custom Spline Line Series.

You might find this useful as a starting point. We also have a fully featured application in the SciChart Examples Suite -> Create A Custom Chart -> Spline Line Series.
Best regards,
Andrew
- Andrew Burnett-Thompson answered 9 years ago
- You must login to post comments
Please login first to submit.

