Hello,
I have been working with an application that plots real-time serial data using a FIFO buffer. I have started programming around the ECG-Monitor example as this is exactly what I am creating.
I have a device that broadcasts real-time ECG data via Bluetooth (HC-05), to be exact. I have paired the device and opened a SerialPort in my program to receive the data. My sampling rate is 256 Hz.
When I used a text file to simulate ECG data, it works perfectly well. However, when I use real-time data, there is a delay in charting that increases as the time increases. An easier way to understand this is, the chart continues plotting for a significant period of time even after I have switched off my hardware device.
I have then come to the conclusion that my data is being received at the rate that I want it to, but the plotting gets delayed at an increasing rate as the time increases.
I am currently using the Direct-X rendering type as this gives me a very smooth plot. I receive the data via SerialPort, write to an array and then to the FIFO buffer.
I’m attaching my code for the same.
namespace SciChart.Examples.Examples.SeeFeaturedApplication.ECGMonitor
{
    public class ECGMonitorViewModel : BaseViewModel
    {
    private Timer _timer;
    private IXyDataSeries<double, double> _series0;
    public static double[] _sourceData = new double[50000];
    private int _currentIndex = 0;
    private int _totalIndex = 0;
    private DoubleRange _yVisibleRange;
    private bool _isBeat;
    private int _heartRate;
    private bool _lastBeat;
    private DateTime _lastBeatTime;
    private ICommand _startCommand;
    private ICommand _stopCommand;
    private const double WindowSize = 5.0;
    private const int TimerInterval = 40;
    public static int counter = 0;
    public static SerialPort mySerialPort=new SerialPort("COM3",9600);

    public ECGMonitorViewModel()
    {
        mySerialPort.Open();
        ECGMonitorViewModel.mySerialPort.WriteLine("A");
        ECGMonitorViewModel.mySerialPort.WriteLine("F");

        _series0 = new XyDataSeries<double, double>() { FifoCapacity = 2460, AcceptsUnsortedData = true };

        YVisibleRange = new DoubleRange(-20, 500);
        _startCommand = new ActionCommand(OnExampleEnter);
        _stopCommand = new ActionCommand(OnExampleExit);
    }

    public ICommand StartCommand
    {
        get
        {
            return _startCommand;
        }
    }

    public ICommand StopCommand
    {
        get
        {
            return _stopCommand;
        }
    }

    public IXyDataSeries<double, double> EcgDataSeries
    {
        get
        {
            return _series0;
        }
        set
        {
            _series0 = value;
            OnPropertyChanged("EcgDataSeries");
        }
    }

    public DoubleRange YVisibleRange
    {
        get
        {
            return _yVisibleRange;
        }
        set
        {
            _yVisibleRange = value;
            OnPropertyChanged("YVisibleRange");
        }
    }

    public bool IsBeat
    {
        get
        {
            return _isBeat;
        }
        set
        {
            if (_isBeat != value)
            {
                _isBeat = value;
                OnPropertyChanged("IsBeat");
            }
        }
    }

    public int HeartRate
    {
        get { return _heartRate; }
        set
        {
            _heartRate = value;
            OnPropertyChanged("HeartRate");
        }
    }

    public void OnExampleExit()
    {
        if (_timer != null)
        {
            _timer.Stop();
            _timer.Elapsed -= TimerElapsed;
            _timer = null;
        }
    }

    public void OnExampleEnter()
    {
        _timer = new Timer(TimerInterval) { AutoReset = true };
        _timer.Elapsed += TimerElapsed;
        _timer.Start();
    }

    private void TimerElapsed(object sender, EventArgs e)
    {
        lock (this)
        {
            for (int i = 0; i < 10; i++)
            {
                AppendPoint(250);
            }

            if ((DateTime.Now - _lastBeatTime).TotalMilliseconds < 120) return;

            IsBeat = _series0.YValues[_series0.Count - 3] > 120 ||
                     _series0.YValues[_series0.Count - 5] > 120 ||
                     _series0.YValues[_series0.Count - 8] > 120;

            if (IsBeat && !_lastBeat)
            {
                HeartRate = (int)(60.0 / (DateTime.Now - _lastBeatTime).TotalSeconds);
                _lastBeatTime = DateTime.Now;
            }
        }
    }

    private void AppendPoint(double sampleRate)
    {
        if (_currentIndex >= _sourceData.Length)
        {
            _currentIndex = 0;
        }

        double voltage = _sourceData[_currentIndex];
        double time = _totalIndex / sampleRate %10;

        if(time==0.00)
        {
            voltage = double.NaN;
        }

        _series0.Append(time, voltage);

        _lastBeat = IsBeat;
        _currentIndex++;
        _totalIndex++;
    }

    public static void mySerialPort_DataReceived(object sender, SerialDataReceivedEventArgs e)
    {
        while (mySerialPort.BytesToRead > 0)
        {
            int b;
            b = mySerialPort.ReadByte();
            _sourceData[counter] = b;
            counter++;
        }
    }
}
}

namespace SciChart.Examples.Examples.SeeFeaturedApplication.ECGMonitor
{
    public partial class ECGMonitorView : UserControl
    {
        public ECGMonitorView()
        {
            InitializeComponent();
            ECGMonitorViewModel.mySerialPort.DataReceived += new SerialDataReceivedEventHandler(ECGMonitorViewModel.mySerialPort_DataReceived);
        }
    }
}
The xaml code is as follows,
<UserControl
         xmlns="http://schemas.microsoft.com/winfx/2006/xaml/presentation"
         xmlns:x="http://schemas.microsoft.com/winfx/2006/xaml"
         xmlns:d="http://schemas.microsoft.com/expression/blend/2008"
         xmlns:i="http://schemas.microsoft.com/expression/2010/interactivity"
         xmlns:local="clr-namespace:SciChart.Examples.Examples.SeeFeaturedApplication.ECGMonitor"
         xmlns:mc="http://schemas.openxmlformats.org/markup-compatibility/2006"
         xmlns:s="http://schemas.abtsoftware.co.uk/scichart"
         xmlns:s3D="http://schemas.abtsoftware.co.uk/scichart3D" xmlns:XamlRasterizer="clr-namespace:SciChart.Drawing.XamlRasterizer;assembly=SciChart.Drawing" x:Class="SciChart.Examples.Examples.SeeFeaturedApplication.ECGMonitor.ECGMonitorView"
         d:DesignHeight="400"
         d:DesignWidth="600"
         mc:Ignorable="d">

<UserControl.Resources>

    <Style TargetType="{x:Type s:RenderSurfaceBase}">
        <Setter Property="Effect">
            <Setter.Value>
                <DropShadowEffect BlurRadius="5"
                                  ShadowDepth="0"
                                  Color="#FFB3E8F6" />
            </Setter.Value>
        </Setter>
    </Style>

    <local:BeatToScaleConverter x:Key="BeatToScaleConverter" />
</UserControl.Resources>

<i:Interaction.Triggers>
    <i:EventTrigger EventName="Loaded">
        <i:InvokeCommandAction Command="{Binding StartCommand}" />
    </i:EventTrigger>
    <i:EventTrigger EventName="Unoaded">
        <i:InvokeCommandAction Command="{Binding StopCommand}" />
    </i:EventTrigger>
</i:Interaction.Triggers>

<Grid>

    <s:SciChartSurface RenderPriority="Low" MaxFrameRate="25" AutoRangeOnStartup="False">

        <s:SciChartSurface.RenderableSeries>
            <s:FastLineRenderableSeries DataSeries="{Binding EcgDataSeries}"
                Stroke="#FFB3E8F6"
                StrokeThickness="2" />
        </s:SciChartSurface.RenderableSeries>

        <s:SciChartSurface.YAxis>
            <s:NumericAxis AxisTitle="Voltage (mV)"
                DrawMinorGridLines="True"
                MaxAutoTicks="5"
                VisibleRange="{Binding YVisibleRange, Mode=TwoWay}" />
        </s:SciChartSurface.YAxis>

        <s:SciChartSurface.XAxis>
            <s:NumericAxis AxisTitle="Seconds (s)" TextFormatting="0.000s" VisibleRange="0, 10" AutoRange="Never"/>
        </s:SciChartSurface.XAxis>

        <s:SciChartSurface.RenderSurface>
            <s3D:Direct3D10RenderSurface/>
        </s:SciChartSurface.RenderSurface>

    </s:SciChartSurface>

    <StackPanel Margin="30,30" Orientation="Horizontal">
        <StackPanel.Effect>
            <DropShadowEffect BlurRadius="5"
                ShadowDepth="0"
                Color="#FFB3E8F6" />
        </StackPanel.Effect>

        <Grid HorizontalAlignment="Left" VerticalAlignment="Top">
            <Canvas x:Name="layer1"
                Width="20"
                Height="20"
                Margin="12,34,10,0">
                <Canvas.RenderTransform>
                    <ScaleTransform CenterX="-6"
                        CenterY="-6"
                        ScaleX="{Binding IsBeat, Converter={StaticResource BeatToScaleConverter}}"
                        ScaleY="{Binding IsBeat, Converter={StaticResource BeatToScaleConverter}}" />
                </Canvas.RenderTransform>
                <Path Data="m 0 0 c -4 -4 -8.866933 -10.79431 -10 -15 0 0 0 -5 5 -5 5 0 5 5 5 5 0 0 0 -5 5 -5 5 0 5.242535 4.02986 5 5 -1 4 -6 11 -10 15 z" Fill="#FFB0E6F4" />
            </Canvas>
        </Grid>

        <TextBlock HorizontalAlignment="Left"
            VerticalAlignment="Top"
            FontFamily="ArialBlack"
            FontSize="36"
            FontWeight="Bold"
            Foreground="#FFB0E6F4"
            Text="{Binding HeartRate}" />
        <TextBlock HorizontalAlignment="Left"
            VerticalAlignment="Top"
            FontFamily="ArialBlack"
            FontSize="36"
            FontWeight="Bold"
            Foreground="#FFB0E6F4"
            Text="BPM" />

    </StackPanel>

    <TextBlock Margin="5"
        HorizontalAlignment="Left"
        VerticalAlignment="Bottom"
        FontSize="9"
        FontStyle="Italic"
        Foreground="#FFB0E6F4"/>

</Grid>
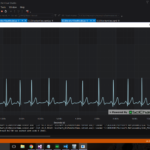
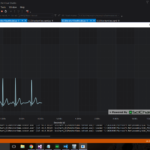
I’ve attached pictures of what my program currently does. I have also attached a file with sample data in case anybody wants to test the program. I have also tried building in release mode and that doesn’t help, either.
The only issue is the delay in plotting of real-time data. Otherwise, the graphing and rendering is really smooth. As I am a complete beginner to this, can somebody help with me with what I might have done wrong?
Thanks a ton,
Jaivignesh Jayakumar
- Jaivignesh Jayakumar asked 8 years ago
- last edited 8 years ago
- You must login to post comments
Hi Jaivignesh,
Is the lag or delay coming from SciChart? Or the timer? It sounds like the timer to me.
Timers in C# are notoriously bad for keeping time. I would suggest analysing why the lag occurs and if it is the timer taking another approach such as the one in the above article.
Best regards,
Andrew
- Andrew Burnett-Thompson answered 8 years ago
- You must login to post comments
Hi Andrew,
Thanks a ton for your insight. I fixed the issue using A simple Multimedia Timer, and ran my program on release mode. That fixed up the bug.
Thanks,
Jaivignesh Jayakumar
- Jaivignesh Jayakumar answered 8 years ago
- You must login to post comments
Hi Andrew,
If the timer is the one at fault, is it the same reason for the delay in your ECG Monitor example too?
Thanks,
Jaivignesh Jayakumar
- Jaivignesh Jayakumar answered 8 years ago
 I would guess yes. Remember our examples are designed to showcase the SciChart API, not to keep perfect time – that’s not our goal! If the timer is drifting then you just need to use another technique to keep or mark time.
- You must login to post comments
UPDATE –
In the ECG Monitor demo, on a sample run out of the box, there is an inherent lag in the x-axis values (time). When compared with an external stopwatch, there is an increasing delay in plotting of the voltage. At (t=50) seconds in the program (x-axis), my stopwatch shows 65 seconds elapsed. Is there any way to work around this issue?
As my program is to be used in real-time medical diagnosis, I can’t have any delay in it.
Thanks,
Jaivignesh Jayakumar
- Jaivignesh Jayakumar answered 8 years ago
- You must login to post comments
Please login first to submit.


