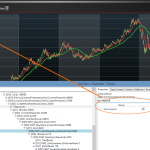
I am stuck and do not seem to be able to make the legend become visible. I use a SciChartGroup and Datatemplate (MainChartView) as follows:
<UserControl x:Class="SciChartSample.Views.MainChartView"
         xmlns="http://schemas.microsoft.com/winfx/2006/xaml/presentation"
         xmlns:x="http://schemas.microsoft.com/winfx/2006/xaml"
         xmlns:mc="http://schemas.openxmlformats.org/markup-compatibility/2006"
         xmlns:d="http://schemas.microsoft.com/expression/blend/2008"
         xmlns:s="http://schemas.abtsoftware.co.uk/scichart"
         xmlns:resources="clr-namespace:SciChartSample.Resources"
         xmlns:i="clr-namespace:System.Windows.Interactivity;assembly=System.Windows.Interactivity"
         xmlns:mvvm="clr-namespace:GalaSoft.MvvmLight.Command;assembly=GalaSoft.MvvmLight.Extras"
         mc:Ignorable="d"
         d:DesignHeight="400" d:DesignWidth="600"
         DataContext="{Binding MainChartViewModel, Source={StaticResource Locator}}">

<i:Interaction.Triggers>
    <i:EventTrigger EventName="SizeChanged">
        <mvvm:EventToCommand
            Command="{Binding UserControlResizedCommand, Mode=OneWay}"
            EventArgsConverterParameter="{Binding ElementName=LayoutRoot}"
            PassEventArgsToCommand="True" />
    </i:EventTrigger>
</i:Interaction.Triggers>

<UserControl.Resources>

    <!-- This allows setting the Height of a pane from a viewmodel -->
    <Style x:Key="ChartPaneStyle" TargetType="s:SciChartGroupPane">
        <Setter Property="Height" Value="{Binding PaneViewModel.Height, Mode=TwoWay}"/>
    </Style>

    <!-- A number of converters which change parameters of charts based on the IsFirstChartPane property -->
    <resources:BoolToValueConverter x:Key="MinorsPerMajorConverter" TrueValue="4" FalseValue="2"/>
    <resources:BoolToValueConverter x:Key="MaxAutoTicksConverter" TrueValue="8" FalseValue="4"/>
    <resources:BoolToValueConverter x:Key="GrowByConverter" >
    <resources:BoolToValueConverter.TrueValue>
        <s:DoubleRange Min="0.05" Max="0.05"/>
    </resources:BoolToValueConverter.TrueValue>
    <resources:BoolToValueConverter.FalseValue>
        <s:DoubleRange Min="0.02" Max="0.02"/>
    </resources:BoolToValueConverter.FalseValue>
    </resources:BoolToValueConverter>
    <resources:IsModifierTypeConverter x:Key="IsModifierTypeConverter" />

</UserControl.Resources>

<Grid>

    <Grid.RowDefinitions>
        <RowDefinition Height="Auto" />
        <RowDefinition Height="*" />
        <RowDefinition Height="Auto" />
    </Grid.RowDefinitions>

    <!-- Databinds a SciChartGroup to a list of ChartPaneViewModels -->
    <!-- Child chart panes are generated using the ItemTemplate below -->
    <s:SciChartGroup Grid.Row="1"
                     ItemsSource="{Binding ChartPaneViewModels}"
                     s:ThemeManager.Theme="{Binding ElementName=ThemeCombo, Path=SelectedItem}"
                     ItemContainerStyle="{StaticResource ChartPaneStyle}">

        <s:SciChartGroup.ItemTemplate>

            <DataTemplate>

                <s:SciStockChart Padding="0"
                                 BorderThickness="0,0,1,1"
                                 ChartTitle="{Binding Title}"
                                 IsXAxisVisible="{Binding IsFirstChartPane}"
                                 IsPanEnabled="{Binding ParentViewModel.IsPanEnabled}"
                                 IsRubberBandZoomEnabled="{Binding ParentViewModel.IsZoomEnabled}"
                                 VerticalChartGroupId="{Binding ParentViewModel.VerticalChartGroupId}"
                                 SeriesSource="{Binding ChartSeriesViewModels}">

                    <s:SciStockChart.XAxisStyle>
                        <Style TargetType="s:CategoryDateTimeAxis">
                            <Setter Property="LabelProvider" Value="{Binding XAxisFormatting}"/>
                            <Setter Property="DrawMajorBands" Value="False"/>
                            <Setter Property="DrawMinorGridLines" Value="False"/>
                            <Setter Property="VisibleRange" Value="{Binding ParentViewModel.XVisibleRange, Mode=TwoWay}"/>
                            <Setter Property="GrowBy" Value="0, 0.02"/>

                        </Style>
                    </s:SciStockChart.XAxisStyle>

                    <s:SciStockChart.YAxisStyle>
                        <Style TargetType="s:NumericAxis">
                            <Setter Property="TextFormatting" Value="{Binding YAxisTextFormatting}"/>
                            <Setter Property="AutoRange" Value="Always"/>
                            <Setter Property="MinorsPerMajor" Value="{Binding IsFirstChartPane, Converter={StaticResource MinorsPerMajorConverter}}"/>
                            <Setter Property="MaxAutoTicks" Value="{Binding IsFirstChartPane, Converter={StaticResource MaxAutoTicksConverter}}"/>
                            <Setter Property="GrowBy" Value="{Binding IsFirstChartPane, Converter={StaticResource GrowByConverter}}"/>
                        </Style>
                    </s:SciStockChart.YAxisStyle>

                </s:SciStockChart>

            </DataTemplate>
        </s:SciChartGroup.ItemTemplate>
    </s:SciChartGroup>

    <StackPanel Grid.Row="0"
                Margin="2,4"
                Orientation="Horizontal">

        <ToggleButton Margin="2"
                      Command="{Binding PanModeCommand}"
                      s:ToggleButtonExtensions.GroupName="Modifiers"
                      IsChecked="True">
            <StackPanel Orientation="Horizontal" Width="47">

                <TextBlock Margin="3" Text="Pan" />
            </StackPanel>
        </ToggleButton>

        <ToggleButton Margin="2"
                      Command="{Binding ZoomModeCommand}"
                      s:ToggleButtonExtensions.GroupName="Modifiers">
            <StackPanel Orientation="Horizontal">

                <TextBlock Margin="3" Text="Zoom" />
            </StackPanel>
        </ToggleButton>

        <Button Margin="2" Command="{Binding ElementName=priceChart, Path=ZoomExtentsCommand}">
            <StackPanel Orientation="Horizontal">

                <TextBlock Margin="3" Text="Zoom Extents" />
            </StackPanel>
        </Button>

    </StackPanel>

    <Button Margin="259,4,261,6">
        <Button Content="LoadData" Height="30" Width="80" Command="{Binding LoadDataCommand}" CommandParameter="UserC"/>
    </Button>


</Grid>
My ChartView looks as follows:
<UserControl x:Class="SciChartSample.Views.ChartView"
         xmlns="http://schemas.microsoft.com/winfx/2006/xaml/presentation"
         xmlns:x="http://schemas.microsoft.com/winfx/2006/xaml"
         xmlns:mc="http://schemas.openxmlformats.org/markup-compatibility/2006"
         xmlns:d="http://schemas.microsoft.com/expression/blend/2008"
         xmlns:visuals="clr-namespace:Abt.Controls.SciChart.Visuals;assembly=Abt.Controls.SciChart.Wpf"
         xmlns:sciChart3="clr-namespace:Abt.Controls.SciChart;assembly=Abt.Controls.SciChart.Wpf"
         xmlns:renderableSeries3="clr-namespace:Abt.Controls.SciChart.Visuals.RenderableSeries;assembly=Abt.Controls.SciChart.Wpf"
         xmlns:pointMarkers="clr-namespace:Abt.Controls.SciChart.Visuals.PointMarkers;assembly=Abt.Controls.SciChart.Wpf"
         xmlns:axes3="clr-namespace:Abt.Controls.SciChart.Visuals.Axes;assembly=Abt.Controls.SciChart.Wpf"
         xmlns:chartModifiers3="clr-namespace:Abt.Controls.SciChart.ChartModifiers;assembly=Abt.Controls.SciChart.Wpf"

         d:DesignHeight="577"
         d:DesignWidth="735"
         mc:Ignorable="d"
         DataContext="{Binding ChartViewModel, Source={StaticResource Locator}}">

<Grid>
    <Grid.ColumnDefinitions>
        <ColumnDefinition Width="368*"/>
        <ColumnDefinition Width="367*"/>
    </Grid.ColumnDefinitions>

    <Grid.RowDefinitions>
        <RowDefinition Height="32"></RowDefinition>
        <RowDefinition Height="*"></RowDefinition>
        <RowDefinition Height="*"></RowDefinition>
    </Grid.RowDefinitions>

    <!-- Define Toolbar -->
    <StackPanel Grid.Row="0" Orientation="Horizontal" Grid.ColumnSpan="2">
        <ToggleButton Content="Zoom" Margin="3"
                      IsChecked="{Binding ZoomEnabled, Mode=TwoWay}"/>
        <ToggleButton Content="Pan" Margin="3"
                      IsChecked="{Binding PanEnabled, Mode=TwoWay}"/>
        <ToggleButton Content="MouseWheel" Margin="3"
                      IsChecked="{Binding MouseWheelEnabled, Mode=TwoWay}"/>
        <ToggleButton Content="Rollover" Margin="3"
                      IsChecked="{Binding RolloverEnabled, Mode=TwoWay}"/>
        <ToggleButton Content="Cursor" Margin="3"
                      IsChecked="{Binding CursorEnabled, Mode=TwoWay}" />
    </StackPanel>

    <visuals:SciChartSurface x:Name="MainChart" Grid.Row="1" sciChart3:ThemeManager.Theme="Chrome" Padding="30" Grid.RowSpan="2" Grid.ColumnSpan="2">

        <visuals:SciChartSurface.RenderableSeries>

            <renderableSeries3:FastLineRenderableSeries SeriesColor="DarkBlue" DataSeries="{Binding ChartData}">
                <renderableSeries3:FastLineRenderableSeries.PointMarker>
                    <pointMarkers:EllipsePointMarker Width="7" Height="7" Stroke="DarkBlue" Fill="DarkBlue" StrokeThickness="1"/>
                </renderableSeries3:FastLineRenderableSeries.PointMarker>
            </renderableSeries3:FastLineRenderableSeries>

        </visuals:SciChartSurface.RenderableSeries>

        <visuals:SciChartSurface.XAxis>
            <axes3:DateTimeAxis
                SubDayTextFormatting="dd/MM/yyyy HH:mm:ss.fff"
                VisibleRange="{Binding ChartData.XValues, Mode=OneWay}"
                GrowBy="0.1,0.1">
            </axes3:DateTimeAxis>
        </visuals:SciChartSurface.XAxis>

        <visuals:SciChartSurface.YAxis>
            <axes3:NumericAxis
                VisibleRange="{Binding ChartData.YValues, Mode=OneWay}"
                GrowBy="0.1,0.1">
            </axes3:NumericAxis>
        </visuals:SciChartSurface.YAxis>

        <visuals:SciChartSurface.ChartModifier>
            <chartModifiers3:ModifierGroup>
                <chartModifiers3:RubberBandXyZoomModifier IsEnabled="{Binding ZoomEnabled, Mode=TwoWay}" IsXAxisOnly="True"></chartModifiers3:RubberBandXyZoomModifier>
                <chartModifiers3:ZoomPanModifier IsEnabled="{Binding PanEnabled, Mode=TwoWay}"></chartModifiers3:ZoomPanModifier>
                <chartModifiers3:MouseWheelZoomModifier IsEnabled="{Binding MouseWheelEnabled, Mode=TwoWay}"></chartModifiers3:MouseWheelZoomModifier>
                <chartModifiers3:RolloverModifier IsEnabled="{Binding RolloverEnabled, Mode=TwoWay}"></chartModifiers3:RolloverModifier>
                <chartModifiers3:CursorModifier IsEnabled="{Binding CursorEnabled, Mode=TwoWay}"  ShowTooltip="True" ShowTooltipOn="Always"  ></chartModifiers3:CursorModifier>
                <chartModifiers3:LegendModifier x:Name="legendSource" ShowLegend="True" Visibility="Visible" GetLegendDataFor="AllSeries"/>
            </chartModifiers3:ModifierGroup>
        </visuals:SciChartSurface.ChartModifier>

    </visuals:SciChartSurface>

    <visuals:SciChartLegend LegendData="{Binding LegendData, ElementName=legendSource, Mode=OneWay}"/>

</Grid>
Please note that I included a legendModifier in the ChartView and also defined a ChartLegend in same. But the legend is not visible at all. What am I doing wrong? Thanks
- bbmat asked 10 years ago
- You must login to post comments
The simplest way to determine if there is a problem is try to reproduce it in our examples.
I just set SciStockChart.ShowLegend=True on one of the SciStockCharts in the CreateMultiPaneStockCharts example at runtime and this is the result (see attached). As you can see there’s something wrong with it.
Give us some time to investigate and we’ll see what we can do.
Best regards,
Andrew
- Andrew Burnett-Thompson answered 10 years ago
 Yes, I should have mentioned that I see an empty legend box, so the bindings to the data series seem to exhibit a problem. Thanks for looking into this.
-
Hi guys, we've investigated this issue and found out that the SeriesName property was not set on DataSeries. Legend obtains text to display from this property, so please try setting it and let us know if you have further questions.
- You must login to post comments
Please login first to submit.

