Hi Guys,
I am just wondering if you can help us with the following issue.
We are trying to create a scatter char. The data series set looks like :
public IDataSeriesSet<float, float> ChartDatafloat
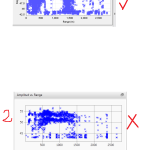
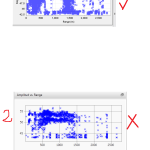
The problem that we are having is that there are points that are missing on the chart when it gets generated. so, we would like if you guys could test with the points that I am attaching (scattercsv.csv) and figure out why this is happening… We have seen that points around 14 and between 2000 and 2050 in the Xaxis are not displaying.
<SciChart:SciChartSurface x:Name="SciChartSurface" SciChart:ThemeManager.Theme="BrightSpark"
                              DataSet="{Binding ChartDataXfloat, Mode=TwoWay}">

        <!-- Declare RenderableSeries -->
        <SciChart:SciChartSurface.RenderableSeries>
            <SciChart:XyScatterRenderableSeries>
                <SciChart:XyScatterRenderableSeries.PointMarkerTemplate>
                    <ControlTemplate>
                        <Grid Height="7" Width="7">
                            <Viewbox>
                                <Path Data="M0,0 L10,10 M0,10 L10,0 M0,5 L10,5" Stretch="Uniform" Stroke="Blue" StrokeThickness="1"/>
                            </Viewbox>
                        </Grid>
                    </ControlTemplate>
                </SciChart:XyScatterRenderableSeries.PointMarkerTemplate>
            </SciChart:XyScatterRenderableSeries>
        </SciChart:SciChartSurface.RenderableSeries>

        <!-- Create an X Axis with Growby -->
        <SciChart:SciChartSurface.XAxis>
            <SciChart:NumericAxis VisibleRange="0,2800">
                <SciChart:NumericAxis.GrowBy>
                    <SciChart:DoubleRange Min="0.1" Max="0.1"/>
                </SciChart:NumericAxis.GrowBy>
            </SciChart:NumericAxis>
        </SciChart:SciChartSurface.XAxis>

        <!-- Create a Y Axis with Growby -->
        <SciChart:SciChartSurface.YAxis>
            <SciChart:NumericAxis>
                <SciChart:NumericAxis.GrowBy>
                    <SciChart:DoubleRange Min="0.1" Max="0.1"/>
                </SciChart:NumericAxis.GrowBy>
            </SciChart:NumericAxis>
        </SciChart:SciChartSurface.YAxis>

    </SciChart:SciChartSurface>
I am attaching as well an image that shows how the chart should looks like. I am only trying to display the blue points. So, chart number 1 displays all the points that I am attaching in the spreadsheet and chart number 2 is the one that I am trying to create with the same points and as you can see is missing some of the points.
Hope you can help us….
Thanks very much
- vaquita50 asked 11 years ago
- You must login to post comments
Hello Vaquita,
Hmmm … you will need to set the ResamplingMode on XyScatterSeries to None. I do apologise, we should do this by default and there is an open work item to make this change (plus develop other Resampling Algorithms which are more suitable to scatter charts with no loss of visual information).
<SciChart:XyScatterRenderableSeries ResamplingMode="None">
 ...
</SciChart:XyScatterRenderableSeries>
Please try this code, it should work. The downside is it will be slower … You may have to disable AntiAliasing also to get the speed up depending on how many data-points you are adding. I also see you are using the new CrossPointMarker – is that from the v2.0 API? If so, great! If not try it vs. the old ControlTemplate point marker as it might be faster!
Best regards,
Andrew
- Andrew Burnett-Thompson answered 11 years ago
 Hi andrew, Thanks very much... this is working perfectly now...
 Note that in SciChart v3.0 and higher the default resampling mode is Auto, which auto-detects the data distribution. Scatter charts should render correctly. Another resampling mode introduced into SciChart v3.0 was ResamplingMode.Cluster2D. This is useful to cluster dense scatter plots and hopefully improve performance when drawing large numbers of points in scatter charts.
- You must login to post comments
Please login first to submit.


