Hi,
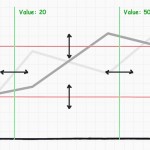
I’ve got the following scenario that I need to implement and it would be very nice if you could give me a jump-start. I need to bind the x-axes values represented by 2 vertical lines and the y-axis values represented by 2 horizontal lines to a viewmodel, so that the values inside the viewmodel change when moving the lines per mouse on the screen and the other way around (see mockup for how it should look like). I think the rollover modifier could be usable for this, but I need some pseudo code or an example app on how to bind the rollover modifiers value to the viewmodel and how to display 4 rollover modifiers on the chart surface.
Thanks
Joerg
- Joerg Hoehn asked 12 years ago
- You must login to post comments
Hi Joerg,
Sounds like what you need is annotations! We have a rich annotations API as of SciChart v1.5, you can see this article which demonstrates how to use it:
Also there is an MVVM sample that does the same thing in the demo app here:
Drag Horizontal Threshold Example
Now if you were to set up something like this:
- A SciChartSurface with two HorizontalLineAnnotations and two VerticalLineAnnotations
- A ViewModel with X1, X2, Y1, Y2 properties, type double. All properties should implement PropertyChanged
- Bind each HorizontalLineAnnotation.X1 to each X property in the ViewModel
- Bind each VerticalLineAnnotation.Y1 to each Y property in the ViewModel
When the user drags the mouse on an annotation you will be notified in the setter of the property in your view model. Likewise you can set the view model properties and the annotation positions will update.
Let me know if that helps,
- Andrew Burnett-Thompson answered 12 years ago
- You must login to post comments
Hello Joerg,
we created an example for you. You only need to add reference on scichart.dll to run this code.
Best regards,
Yuriy
- Yuriy Zadereckiy answered 12 years ago
 Great Example! Thanks a lot! :)
 Hi Yura, Thanks for the sample. I tried out with the sample by adding in RubberBandXyZoomModifier and ZoomExtentsModifier. I found out that when I tried to click and drag the line, zooming is also performing. Setting IsEnabled to false on modifiers stops this behavior, it allows you to control which modifier is active.
- You must login to post comments
Please login first to submit.


