In our app we have a feature by which user can add indicators. These indicators can consist of 2 or a maximum of 4 lines.
We don’t want to render svg tooltips(which setted up by the default) with data for each line, instead of that we get point data and pass it to our app inner service that can render indicator legend.
To prevent default tooltips from being displayed we set for each renderable series of an indicator the following values.
rolloverModifierProps.width = 0; rolloverModifierProps.height = 0;
But of course tooltips are still rendered in the DOM and this leads to performance issues when we have 3 or more indicators of this type.
My question is the following
How we can render only circles svg for rollover modifier and completely dont render svg for tooltips in the DOM?
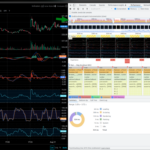
This is what the indicators look like
- Sergey Chernyakov asked 8 months ago
- last edited 8 months ago
 Hello, have you tried “showTooltip” option? https://www.scichart.com/documentation/js/current/typedoc/interfaces/irollovermodifieroptions.html#showtooltip
- You must login to post comments
Hi Sergey,
Have you profiled this? I would suspect the issue is not the rendering of tooltips in the DOM or SVG, but the Hit-Test algorithm used by the RolloverModifier to get the x,y point at mouse location. This is still un-optimised and a lot of potential for improvement.
Can you do two things?
-
profile the code using Performance Profiler in Firefox Developer edition. This provides very high detailed profiling results and will tell you line by line what code is using time
-
Send us code for how you’ve configured the
RolloverModifierand setup the data inXyDataSeries. This matters as there are several modes & some use more CPU than others. For example. if your data is unsorted in X-direction (which can happen by mistake) then Rolllover must use a slower method to find X,Y points at a mouse coordinate. -
Finally tell us some stats about number of data points in the chart & number of series
A full working sample in Codesandbox would be helpful but not necessary to reproduce this. Just some info as above
Best regards
Andrew
- Andrew Burnett-Thompson answered 8 months ago
- You must login to post comments
I did what you asked and here are the results
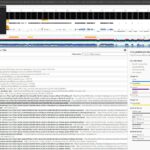
- I profiled using FF dev tools and i see the same as in chrome dev-tools. The most cosumable task is drawing line annotations I have attached a performance profile screenshot so you can see for yourself.
- Here is cofiguration of RolloverModifier and DataSiries in out app
DataSeries
const { wasmContext, sciChartSurface } = chart;
    this.seriesData = new XyDataSeries(wasmContext); // All data series are configured this way
    this.series = new FastMountainRenderableSeries(wasmContext, { dataSeries: this.seriesData });
    this.series.rolloverModifierProps.width = 0;
    this.series.rolloverModifierProps.height = 0;
    sciChartSurface.renderableSeries.add(this.series);
RolloverModifier
const rolloverModifier = new RolloverModifier({
      ...colors.rolloverModifier,
      showRolloverLine: true,
      modifierGroup: this._groupId,
      rolloverLineStrokeThickness: 1,
    });
Chart performance begins to drop noticeably starts from 4 sub-charts each of which consists of 3 rendereble series in 268+ data points per each. Also with main chart which consist of 2 renderable series in 268+ data points per each chart line
- Sergey Chernyakov answered 8 months ago
- You must login to post comments
Please login first to submit.


