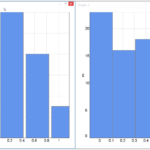
I’m trying to render Histograms at runtime where the bins’ information like upper and lower bounds and width are known. However when I set the DataPointWidth to 0.2 for example, the bin spacing is different. Here is my code and XAML:
        // We can create a histogram with evenly spaced bins
        // by specifying the lower bound, the upper bound,
        // and the number of bins:
        var histogram = Histogram.CreateEmpty(values.Min(), values.Max(), numberOfBins);
        double width = (values.Max() - values.Min()) / numberOfBins;
        histogram.Tabulate(values);

        foreach (var bin in histogram.BinsAndValues)
        {
            XyDataSeries<double, double> dataSeries = new XyDataSeries<double, double>();
            dataSeries.Append(bin.Key.LowerBound, bin.Value);
            pointList.Add(new ColumnRenderableSeriesViewModel() { DataSeries = dataSeries, StrokeThickness = 2, Stroke = Colors.Gray, Fill = Brushes.CornflowerBlue, DataPointWidth = 0.2 });
        }

        ChartData = new ObservableCollection<IRenderableSeriesViewModel>(pointList);

        <Style x:Key="BaseColumnStyle" TargetType="s:FastColumnRenderableSeries">
        <Setter Property="Opacity" Value="0.3"/>
        <Setter Property="StrokeThickness" Value="2"/>
    </Style>

    <Style x:Key="BlueColumnStyle" BasedOn="{StaticResource BaseColumnStyle}" TargetType="s:FastColumnRenderableSeries">
        <Setter Property="Fill" Value="CornflowerBlue"/>
    </Style>
    <!--  Define styles for the SciChartSurface  -->
    <Style x:Key="SciChartSurfaceStyle" TargetType="s:SciChartSurface">
        <Setter Property="Background" Value="White"/>
        <Setter Property="Padding" Value="20"/>
        <Setter Property="Foreground" Value="Black"/>
        <Setter Property="FontSize" Value="20"/>
        <Setter Property="FontFamily" Value="Arial Black"/>
        <Setter Property="FontWeight" Value="Bold"/>
    </Style>

    <!--  Define styles for the GridLinesPanel  -->
    <Style x:Key="GridLinesPanelStyle" TargetType="s:GridLinesPanel">
        <Setter Property="Background" Value="White"/>
        <Setter Property="BorderThickness" Value="1"/>
        <Setter Property="BorderBrush" Value="Black"/>
    </Style>

    <!--  Using the LayoutTransform is much more apropriate in this point  -->
    <!--  the RenderTransform is used for demonstration purposes only,  -->
    <!--  for the compatibility with Silverlight reasons  -->
    <Style x:Key="AxisLabelStyle" TargetType="s:DefaultTickLabel">
        <!--<Setter Property="RenderTransform">
            <Setter.Value>
                <RotateTransform Angle="-15"/>
            </Setter.Value>
        </Setter>-->
        <Setter Property="Margin" Value="0"/>
    </Style>

    <!--  Define styles for the X and Y Axes  -->
    <Style x:Key="AxisStyle" TargetType="s:AxisBase">
        <Setter Property="FontSize" Value="18"/>
        <Setter Property="FontWeight" Value="Normal"/>
        <Setter Property="FontFamily" Value="Arial"/>
        <Setter Property="TitleFontSize" Value="12"/>
        <Setter Property="TitleFontWeight" Value="Bold"/>
        <Setter Property="TickTextBrush" Value="Black"/>
        <Setter Property="DrawMajorBands" Value="False"/>
        <Setter Property="DrawMinorGridLines" Value="False"/>
        <Setter Property="DrawMinorTicks" Value="False" />
        <Setter Property="DrawMajorTicks" Value="False"/>
        <Setter Property="TickLabelStyle" Value="{StaticResource AxisLabelStyle}"/>
        <Setter Property="MajorGridLineStyle">
            <Setter.Value>
                <Style TargetType="Line">
                    <Setter Property="Stroke" Value="LightGray"/>
                    <Setter Property="StrokeThickness" Value="1"/>
                </Style>
            </Setter.Value>
        </Setter>
    </Style>
</UserControl.Resources>
<Grid>
    <s:SciChartSurface x:Name="histogram" ChartTitle="{Binding ChartTitle}" RenderableSeries="{s:SeriesBinding ChartData}"
                       Style="{StaticResource SciChartSurfaceStyle}" GridLinesPanelStyle="{StaticResource GridLinesPanelStyle}">
        <s:SciChartSurface.XAxis>
            <s:NumericAxis AxisTitle="{Binding XAxisTitle}" Style="{StaticResource AxisStyle}" AutoRange="Always"/>
        </s:SciChartSurface.XAxis>
        <s:SciChartSurface.YAxis>
            <s:NumericAxis AxisTitle="{Binding YAxisTitle}" AxisAlignment="Left" Style="{StaticResource AxisStyle}"/>
        </s:SciChartSurface.YAxis>
    </s:SciChartSurface>
</Grid>
How can I make the bin spacing the same independent of bin width? See my attachment of two different histograms with the DataPointWidth for each.
- Dave Frey asked 7 years ago
 Hi Mark, it is not quite clear to me what you want to do. DataPointWidth is a relative width of a single column. If you set it to “1”, all columns will be merged together. If you set it to a smaller value > 0, columns will become narrower. Could you please clarify how your desired chart should look?
- You must login to post comments
Hi Yuriy,
I would like to keep the DataPointWidth constant and have all the bins (columns) with minimal or no gap like the histogram on the right. Do I have to calculate that value based on the data I’m plotting?
Thanks,
Mark
- Dave Frey answered 7 years ago
 Hi Mark, thanks for clarification. I’ve noticed that you have several ColumnSeries with one point each. May I ask, what is the reason for this? Why don’t you want to have one ColumnSeries with all the data in it and DataPointWidth set to “1”? Here is an example: https://www.scichart.com/wpf-chart-example-column-chart
- You must login to post comments
Yuriy,
Your reply helped me find where I was making a mistake. I moved the line where I’m adding a ColumnRenderableSeriesViewModel to the XyDataSeries out the for loop.
Thanks,
Mark
- Dave Frey answered 7 years ago
- You must login to post comments
Please login first to submit.

