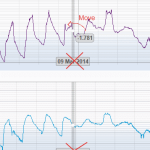
I have four charts based on the “Synchronize Multi Chart Mouse” example. How do I modify the appearance of the rollover modifier? I marked up the attached image with what I wish to accomplish.
1) move the Y axis value that appears on a point to above the point so it isn’t partially hidden by the cursor
2) only show the X axis value on the bottom-most chart
3) format the Time on the xaxis value to include hours and minutes
Regards,
shawn
- sricker asked 10 years ago
- You must login to post comments
I know its an old question but in the interest of keeping the Q&A up to date here are some suggestions!
-
The RolloverModifier tooltip label on the XAxis can be shown or hidden by the ShowAxisLabels property. I suggest binding that property to some value determining if the chart is the last chart in a group or not
-
The formatting of the RolloverModifier label obeys AxisBase.CursorTextFormatting. It also obeys cursor text format output of LabelProviders.
-
Moving the rollover tooltip I don’t think is possible, but we are about to release some enhancements to template the tooltips in v3.1.
Hope this helps,
Andrew
- Andrew Burnett-Thompson answered 10 years ago
- You must login to post comments
Update: v3.2+
We now have a number of articles on how to style the RolloverModifier and TooltipModifier. Please see
- Adding TimeSeries Tooltips with the RolloverModifier. Scroll down to Styling the RolloverModifier
- Also of interest is Adding RolloverMarkers for the RolloverModifier
- … and SeriesInfo – The Series ViewModel for Legends, Tooltips, Rollovers
- … and Adding Data-Point Tooltips with the TooltipModifier
Best regards,
SciChart Team
- Andrew Burnett-Thompson answered 9 years ago
- You must login to post comments
Please login first to submit.

