Hi,
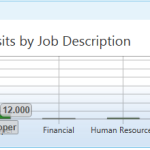
I’m using the rollover modifer on some charts. I’m using an XYDataSeries<int, int>. However, the tooltip is displaying the Y values as decimal with 3 floating precision (screenshot attached), while what I want is a simple integer to show. Here’s the chart code in xaml:
<s:SciChartSurface FlowDirection="LeftToRight" s:ThemeManager.Theme="Chrome" SeriesSource="{Binding Series}" ChartTitle="{Binding Title}" HorizontalAlignment="Stretch" VerticalAlignment="Stretch" Name="chrtSurface" MouseDoubleClick="ChrtSurface_OnMouseDoubleClick" Tag="{Binding}">
                                <s:SciChartSurface.XAxis>
                                    <s:NumericAxis LabelProvider="{Binding LabelProvider}" AutoTicks="False" MajorDelta="1" MinorDelta="1" DrawMinorGridLines="False">
                                    </s:NumericAxis>
                                </s:SciChartSurface.XAxis>

                                <s:SciChartSurface.YAxis>
                                    <s:NumericAxis GrowBy="0,1" AxisTitle ="{Binding YAxisLabel}">
                                    </s:NumericAxis>
                                </s:SciChartSurface.YAxis>

                                <s:SciChartSurface.ChartModifier>
                                    <s:ModifierGroup>
                                        <s:LegendModifier GetLegendDataFor="AllSeries" ShowLegend="{Binding IsMultiChart}" ShowVisibilityCheckboxes="False">
                                            <s:SciChartLegend Margin="23,23" Orientation="Horizontal" LegendData="{Binding SeriesInfos}" >
                                            </s:SciChartLegend>
                                        </s:LegendModifier>
                                        <s:RubberBandXyZoomModifier IsXAxisOnly="True" />
                                        <s:ZoomExtentsModifier ExecuteOn="MouseRightButton"/>
                                        <s:RolloverModifier ShowAxisLabels="{Binding IsNotEmptyChart}"></s:RolloverModifier>
                                        <s:MouseWheelZoomModifier></s:MouseWheelZoomModifier>
                                    </s:ModifierGroup>
                                </s:SciChartSurface.ChartModifier>
                            </s:SciChartSurface>
- cabdo asked 9 years ago
- last edited 9 years ago
- You must login to post comments
Hi there,
To change the appearance of the RolloverModifier, please see our new article titled Adding TimeSeries Tooltips with the RolloverModifier.
Scroll down to the section titled
Changing the Rollover Tooltip ControlTemplate
For example, you can bind to XValues, YValues, SeriesName and change string formats using a template similar to this one below
<!-- The Tooltip Control Template, Binds to SeriesInfo -->
<ControlTemplate x:Key="TooltipTemplate" TargetType="s:TemplatableControl">
    <Border Background="#67EA67"
                        BorderBrush="DarkGreen"
                        BorderThickness="1"
                        CornerRadius="1"
                        Padding="5"
                        Opacity="0.9">
        <StackPanel Orientation="Vertical">
            <TextBlock FontSize="14" Text="{Binding SeriesName}" FontWeight="Bold" Foreground="#222"/>
            <Border Height="1" HorizontalAlignment="Stretch" VerticalAlignment="Center" Background="#222"/>
            <TextBlock FontSize="12" Foreground="#222">
                <Run Text="X: " FontWeight="Bold" />
                <Run Text="{Binding XValue, StringFormat=\{0:0.000\}}" />
            </TextBlock>
            <TextBlock FontSize="12" Foreground="#222">
                <Run Text="Y: " FontWeight="Bold" />
                <Run Text="{Binding YValue, StringFormat=\{0:0.000\}}" />
            </TextBlock>
        </StackPanel>
    </Border>
</ControlTemplate>
Finally, for more info on the SeriesInfo types (the viewmodels for tooltips), please see the article SeriesInfo – The Series ViewModel for Legends, Tooltips, Rollovers.
Hope this helps!
- Andrew Burnett-Thompson answered 9 years ago
- You must login to post comments
Please login first to submit.

