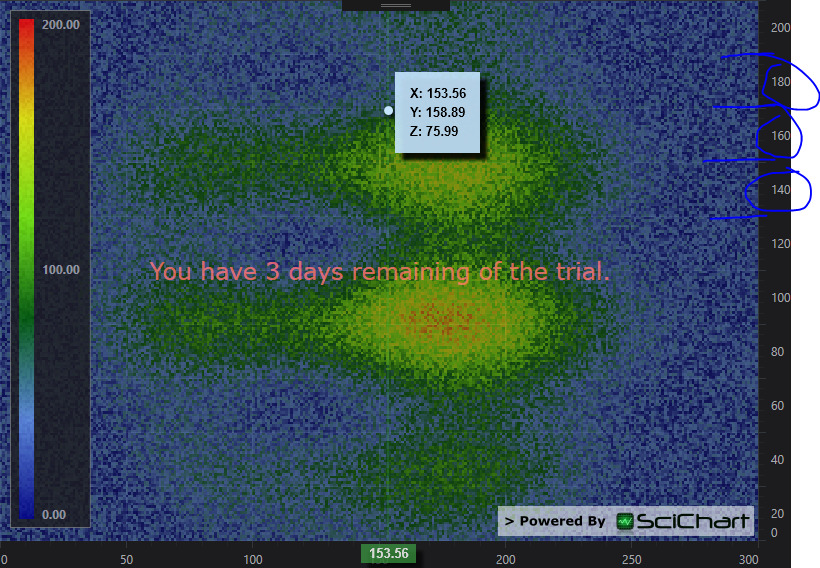
I am using the 2D Heatmap with text as my working prototype. I wish to have a secondary Axis on the opposite side of my man Axis that displays a count for that row or column. To display this information is simple enough through using the LabelProvider (although two lines maybe a bit tricky), and I can do some stuff with the TickProvider when it gets a bit too busy.
My question is on how I can position these TickLabels to be in the center of a row/column?
My first thought was I could be cheeky and set the margin value to offset it in its style but it seems it only works so far with the TickLabel just displayed below the tick.
        <Style x:Key="LeftAxisLabelStyle" TargetType="s:NumericTickLabel">
                   <Setter Property="Margin" Value="0,0,0,-30"/>
        </Style>

What I am trying to achieve seems to be the default positioning for column charts, and histograms. I was wondering if there is a behind the scenes option or an override I’ve missed to set this?
Alternatively annotations maybe the way to go but I get the impression that this is more for on chart labels rather than for Axis?
p.s. I think when dealing with multiple Axes, you should give an warning/error if an “Id” is not given to secondary Axis as the graph will just show blank.
- Matthew Bristow asked 7 years ago
- You must login to post comments
Hi Matthew
I’ve been thinking about this as it is not an easy problem. Today the solution came to me! Use two axis, and modify the label placement on one!
Try this code:
MainWindow.xaml
<Window x:Class="WpfApplication17.MainWindow"
        xmlns="http://schemas.microsoft.com/winfx/2006/xaml/presentation"
        xmlns:x="http://schemas.microsoft.com/winfx/2006/xaml"
        xmlns:d="http://schemas.microsoft.com/expression/blend/2008"
        xmlns:mc="http://schemas.openxmlformats.org/markup-compatibility/2006"
        xmlns:local="clr-namespace:WpfApplication17"
        xmlns:s="http://schemas.abtsoftware.co.uk/scichart"
        mc:Ignorable="d"
        Title="MainWindow" Height="350" Width="525">
    <Grid>
        <Grid.ColumnDefinitions>
            <ColumnDefinition Width="Auto"/>
            <ColumnDefinition Width="*"/>
        </Grid.ColumnDefinitions>

        <s:SciChartSurface x:Name="sciChart" Grid.Column="1" Padding="0" BorderThickness="0">

            <s:SciChartSurface.RenderableSeries>
                <s:FastHeatMapRenderableSeries x:Name="heatmapSeries" Opacity="0.5" Maximum="200">
                    <s:FastHeatMapRenderableSeries.ColorMap>
                        <LinearGradientBrush>
                            <GradientStop Offset="0" Color="DarkBlue"/>
                            <GradientStop Offset="0.2" Color="CornflowerBlue"/>
                            <GradientStop Offset="0.4" Color="DarkGreen"/>
                            <GradientStop Offset="0.6" Color="Chartreuse"/>
                            <GradientStop Offset="0.8" Color="Yellow"/>
                            <GradientStop Offset="1" Color="Red"/>
                        </LinearGradientBrush>
                    </s:FastHeatMapRenderableSeries.ColorMap>
                </s:FastHeatMapRenderableSeries>
            </s:SciChartSurface.RenderableSeries>

            <s:SciChartSurface.XAxis>
                <s:NumericAxis DrawMajorBands="True"/>
            </s:SciChartSurface.XAxis>

            <s:SciChartSurface.YAxes>
                <s:NumericAxis x:Name="primaryAxis" DrawMajorBands="True" DrawLabels="False"/>
                <local:NumericAxisEx Id="HiddenSecondaryAxis"
                                     IsLabelCullingEnabled="False"
                                     DrawMajorTicks="False"
                                     DrawMinorTicks="False"
                                     VisibleRange="{Binding ElementName=primaryAxis, Path=VisibleRange, Mode=TwoWay}"/>
            </s:SciChartSurface.YAxes>

            <s:SciChartSurface.ChartModifier>
                <s:ModifierGroup>
                    <s:RubberBandXyZoomModifier/>
                    <s:ZoomExtentsModifier/>
                    <s:RolloverModifier ShowTooltipOn="Always" UseInterpolation="True" ReceiveHandledEvents="True"/>
                    <s:RubberBandXyZoomModifier ExecuteOn="MouseLeftButton"/>
                    <s:ZoomExtentsModifier ExecuteOn="MouseDoubleClick"/>
                </s:ModifierGroup>
            </s:SciChartSurface.ChartModifier>

        </s:SciChartSurface>

        <s:HeatmapColourMap Margin="10,10,60,40" Grid.Column="1" HorizontalAlignment="Left" VerticalAlignment="Stretch" Background="{Binding ElementName=sciChart, Path=Background}" Foreground="{Binding ElementName=sciChart, Path=Foreground}" ColorMap="{Binding ElementName=heatmapSeries, Path=ColorMap}" Minimum="{Binding ElementName=heatmapSeries, Path=Minimum}" Maximum="{Binding ElementName=heatmapSeries, Path=Maximum}" TextFormatting="0.00" Opacity="0.8" BorderBrush="#777" BorderThickness="1" Orientation="Vertical"/>
    </Grid>
</Window>
MainWindow.xaml.cs
using System;
using System.Collections.Generic;
using System.Linq;
using System.Text;
using System.Threading.Tasks;
using System.Windows;
using System.Windows.Controls;
using System.Windows.Data;
using System.Windows.Documents;
using System.Windows.Input;
using System.Windows.Media;
using System.Windows.Media.Imaging;
using System.Windows.Navigation;
using System.Windows.Shapes;
using SciChart.Charting.Model.DataSeries;
using SciChart.Charting.Numerics.CoordinateProviders;
using SciChart.Charting.Themes;
using SciChart.Charting.Visuals.Axes;

namespace WpfApplication17
{
    /// <summary>
    /// Interaction logic for MainWindow.xaml
    /// </summary>
    public partial class MainWindow : Window
    {
        readonly Random _random = new Random();

        public MainWindow()
        {
            InitializeComponent();

            heatmapSeries.DataSeries = CreateSeries(0);
        }

        private IDataSeries CreateSeries(int index)
        {
            double angle = Math.PI * 2 * index / 30;
            int w = 300, h = 200;
            var data = new double[h, w];
            for (int x = 0; x < w; x++)
            for (int y = 0; y < h; y++)
            {
                var v = (1 + Math.Sin(x * 0.04 + angle)) * 50 + (1 + Math.Sin(y * 0.1 + angle)) * 50 * (1 + Math.Sin(angle * 2));
                var cx = 150; var cy = 100;
                var r = Math.Sqrt((x - cx) * (x - cx) + (y - cy) * (y - cy));
                var exp = Math.Max(0, 1 - r * 0.008);
                data[y, x] = (v * exp + _random.NextDouble() * 50);

            }
            return new Heatmap2DArrayDataSeries<int, int, double>(data, ix => ix, iy => iy);
        }
    }

    public class NumericAxisEx : NumericAxis
    {
        protected override void DrawTickLabels(AxisCanvas canvas, TickCoordinates tickCoords, float offset)
        {
            if (tickCoords.MajorTickCoordinates != null &&
                tickCoords.MajorTickCoordinates.Length > 2)
            {
                offset += (tickCoords.MajorTickCoordinates[1] - tickCoords.MajorTickCoordinates[0]) * 0.5f;
            }

            base.DrawTickLabels(canvas, tickCoords, offset);
        }
    }

}
This results in the following output:

How it works
The secondary axis overrides AxisBase.DrawTickLabels. Here we compute an offset from the given coordinates, and modify that offset slightly. Then call the base for drawing.
We have two YAxis in the SciChartSurface. A primary axis used for all your series which draws Gridlines and ticks, and a secondary one which is invisible apart from labels.
You can further transform the numeric values to strings (if necessary) using the technique described here:
Best regards,
Andrew
- Andrew Burnett-Thompson answered 7 years ago
- You must login to post comments
Please login first to submit.
