Hi,
I’m working with FastRenderableLineSeries and realized that re-sizing a graph to be smaller hides some of the series that has a lot of points in them. Is this intended to be like that? I was hoping there was a setting somewhere that I can increase the threshold if that’s the case.
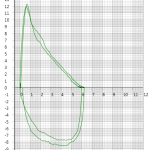
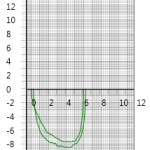
Here’s an example, the disapearing data are separate series. There are a total of 4 series in the graph.
Thanks.
- kewur asked 10 years ago
- You must login to post comments
Thanks to Andrew, setting the ResamplingMode to Auto seems to have fixed the problem
- kewur answered 10 years ago
 Fantastic! :) ResamplingMode.Auto is now the default in v3.x and up. This will detect the distribution of your data (evenly spaced time-series, unevenly spaced time-series, unsorted) and will apply the correct resampling and transformation algorithms. Please note, that sorted data in X is still faster in v3.x but SciChart will always draw correctly with the default (Auto) resampling mode
- You must login to post comments
Please login first to submit.


