Hi,
I have 3 questions regarding the FastHeatMapRenderableSeries
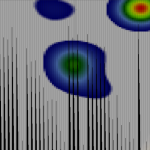
First, I would like to ask whether it possible to use the transparent color FastHeatMapRenderableSeries, even when the map itseft is opaque (Opacity=1)? I tried to include the transparent color into the ColorMap gradient brush, but then the corresponding data values are shown in white.
Second, when the heatmap is scaled, the semi-transparent cell borders are visible on the heatmap. Can I get rid of them, for example, with the UseLayoutRounding or proper scaling?
Finally, if I continuously refresh the heatmap with incoming data, I see some rendering artifacts in some frames. The artifacts are usually black vertical stripes or, more rarely, rectangles. Can it be related to graphics hardware?
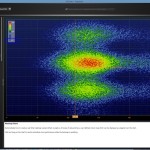
I made a screenshot demonstrating all 3 problems and attached it here.
Thank you very much in advance!
Ilia
- corvex asked 9 years ago
- You must login to post comments
Hi Ilia,
The good news is, we’ve fixed a bug in SciChart’s Heatmap implementation where Alpha channel of the colour map was ignored. This has been fixed in all three renderers (High Speed, High Quality and DirectX) and has been deployed to our nightly build, v3.3.3.6235.
SciChart v3.3.3.6235 via ABT Software NuGet
-
Regarding the cell edges, this might be intentional, I will check back with the team.
-
Regarding the black artefacts, we can’t reproduce this, can you send a code sample to us?
Best regards,
Andrew
- Andrew Burnett-Thompson answered 9 years ago
 Dear Andrew, It's great news that transparency is fixed, it's most wanted! Just a question, I use the version 3.1.0.4759 and our update subscription has been expired. Do I need to renew our license in order to get this fix? Regarding the sources with artefacts, I am going to prepare it in a couple of days and send to you. Thanks in advance! Ilia
- You must login to post comments
Dear Andrew,
I created a simple VS2013 project that replicates the rendering artifacts on the heatmap plot (attached). I can see that the issue is related to multiple STA (UI) threads created to render the same dataseries in separate windows. When the windows are created with the main UI thread, there are no problems with rendering.
However, since I need multiple STA threads in my application, I would like to ask whether it’s possible to fix that issue? It could be beneficial for the real-time application scenarios. I tried to google for different solutions and found that the Visiblox team has experienced the similar issue:
https://www.visiblox.com/blog/posts/2013/12/18/multiple-ui-threads-in-wpf
Thank you in advance!
Ilia
- corvex answered 9 years ago
- last edited 9 years ago
 I'm afraid we don't support multiple STAThreads and have no plans to. However, I can tell you that we do plan to implement multi-threaded drawing within SciChart itself as part of the next major version. Hope this helps,
 Hi Andrew, It's a not big problem, I can live with that now and will look forward for the next version. However, do you know exactly, what causes these rendering artifacts? Since all other scichart features work fine on multiple STA, I can try to fix the artifacts it on my side. Thanks again, Ilia
- You must login to post comments
Please login first to submit.


