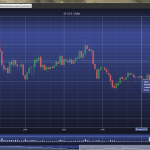
On my x axis, how can I keep from showing duplicate ticks?
On my y axis, how do I right justify all my values?
- tpayton asked 11 years ago
- You must login to post comments
Hi there,
Please, try this workaround for Y axis labels alignment:
<SciChart:SciChartSurface.YAxis>
                <SciChart:NumericAxis AxisAlignment="Left" GrowBy="0, 0.1" >
                    <SciChart:NumericAxis.Resources>
                        <Style TargetType="TextBlock">
                            <Setter Property="Canvas.Right" Value="8"></Setter>
                        </Style>
                    </SciChart:NumericAxis.Resources>
                </SciChart:NumericAxis>
        </SciChart:SciChartSurface.YAxis>
MajorTick’s length is 6 dpi by default, so you can choose any greater value(as 8 in the code above).
Hope this helps!
Best regards,
Yuriy
- Yuriy Zadereckiy answered 11 years ago
 Thanks. The alignment code worked well
- You must login to post comments
Hi,
You need to set the IAxis.TextFormatting property to proper formatting string, e.g. XAxis.TextFormatting=”0.#####”. Also you could use a LabelFormatter feature, please, take a look at Screenshots, XPS Printing, X-Axis Text Labels tutorial.
Regarding labels alignment on Y axis, it can’t be changed in SciChart 1.x, but we are going to provide such capabilities in 2.0 version. We can look for a workaround if this is critical issue for you. Also you could consider having YAxis on the right rather than on the left.
Also, I noticed that your chart has empty space between Y axis and the chart area, is it intentionally or this is not desired?
Please, don’t hesitate to ask if you have questions or need any assistance!
Best regards,
Yuriy
- Yuriy Zadereckiy answered 11 years ago
 On the x axis, I dont want more precision than a single decimal place (which I have). I just dont want them to be repeated. Is this possible? Putting the yaxis on the right is not an option. The space between the axis and the chart is not desired, but if I cant right-align the Y axis I would rather keep the space. It makes the numbers easier to read.
 Hi, OK, you could just omit labels, which are repeated. You should create LabelFormatter, save previous label text as a field and return empty string from the LabelFormatter.FormatLabel() if previous and current strings are the same. Regarding Y axis labels, let us to look for some workaround for you. And I can't imagine why this space between the chart and ticks appears. Do you set Margin or Padding or BorderThickness on YAxis? Best regards, Yuriy
- You must login to post comments
Please login first to submit.

