Hi,
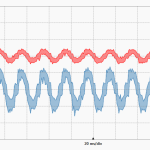
When we have 9 horizontal gridlines, we would also like to see 9 yvalues.
Is it possible to also show 300 and -500 on Yaxis1 and 500 and -300 on Yaxis2
(see attachment)
Thanks and best regards,
Egbert
- EJansen asked 10 years ago
- You must login to post comments
Hi Egbert,
We have added the ability to show Min Max ticks on an axis, as well as many other axis enhancements such as the TickProvider API in v3.0 of SciChart. Please see this related post on CategoryDateTimeAxis Grid Lines.
Using the TickProvider API
In SciChart v3.0 and above, there is now a way to override the exact Tick Intervals.
See this KB article on Advanced Tick Frequency Overriding which introduces the TickProvider API. This allows exact calculation of ticks (Axis Major, Minor gridlines and labels) as the axis is drawn.
Best regards,
Andrew
- Andrew Burnett-Thompson answered 10 years ago
- You must login to post comments
Please login first to submit.

