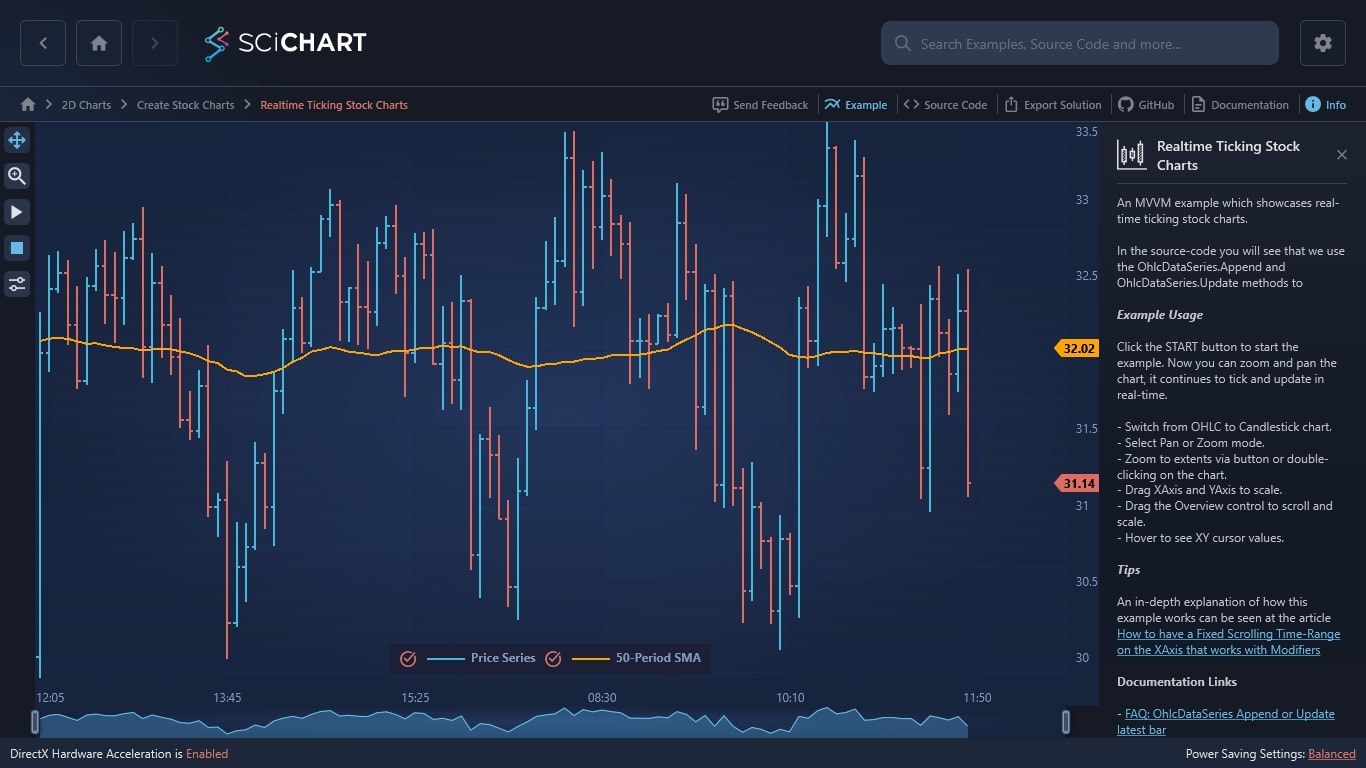
Pre loader
Try wave

Real-Time WPF Chart

Supercharge your real-time WPF charts with SciChart.

SciChart’s software powers the world’s fastest WPF real-time charts, including 2D and 3D data visualizations for desktop.

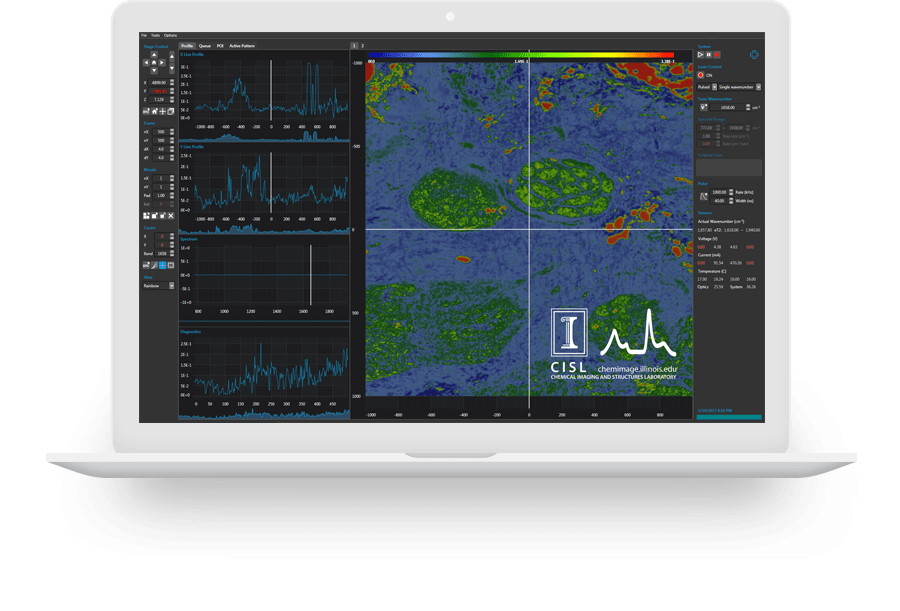
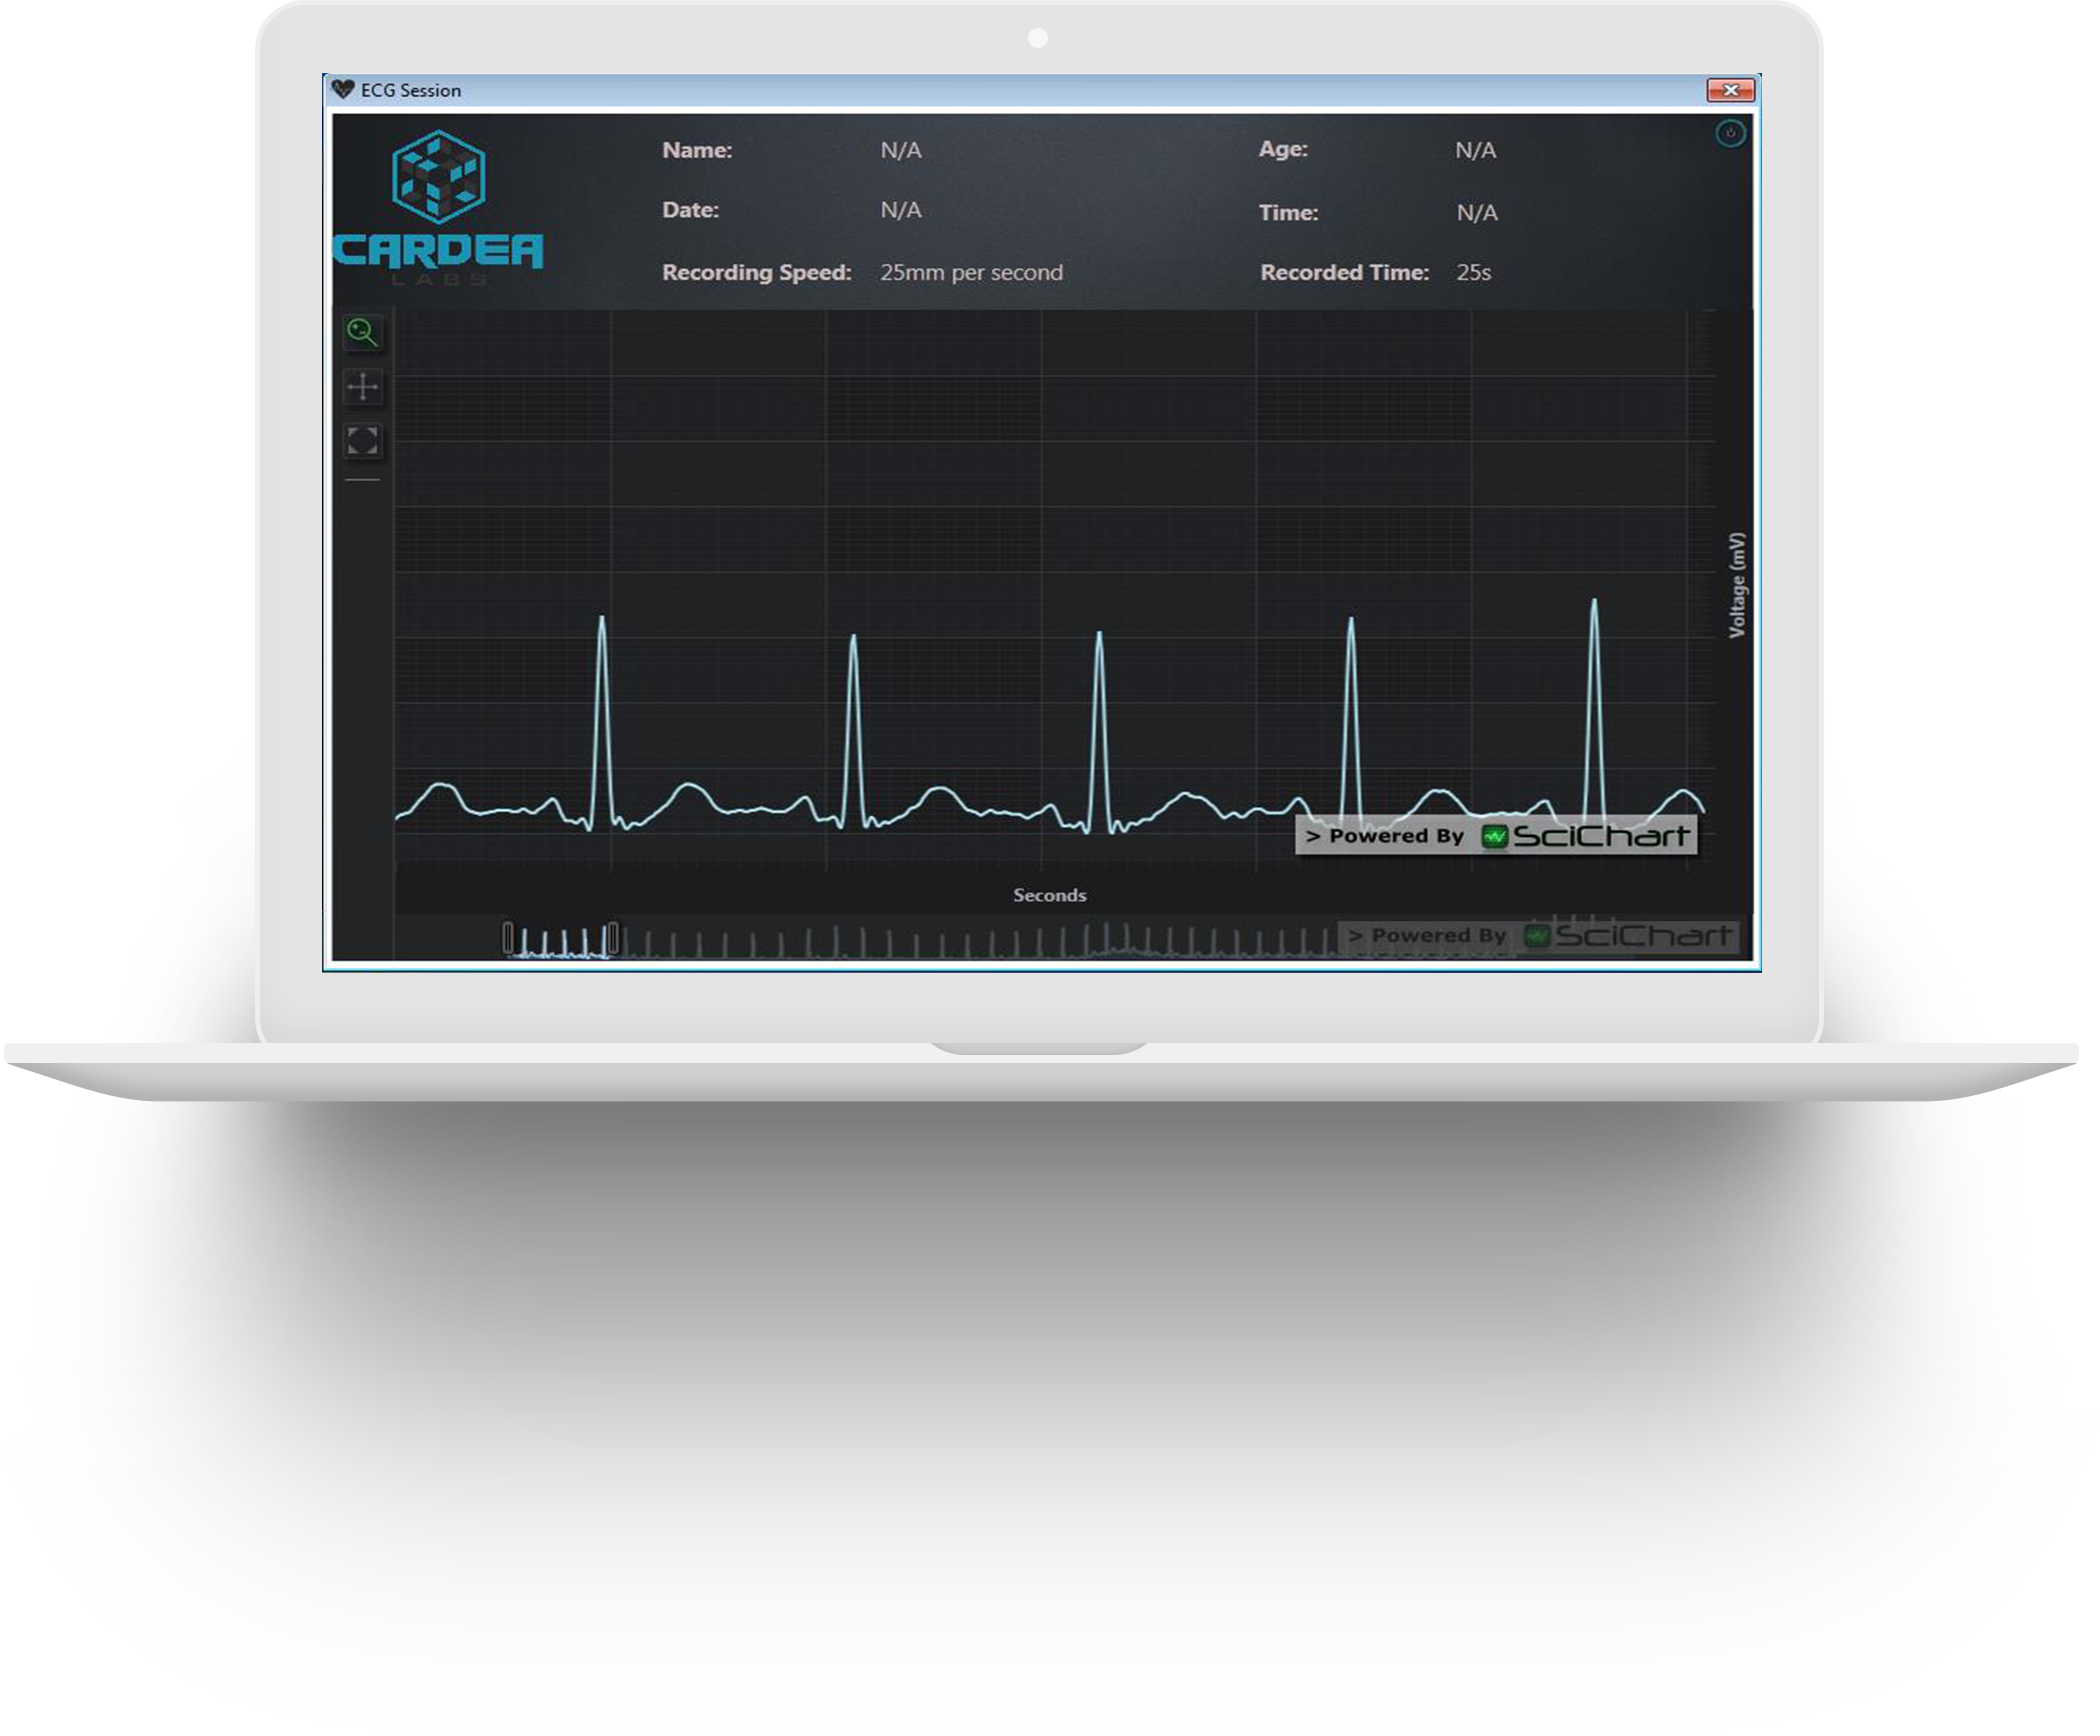
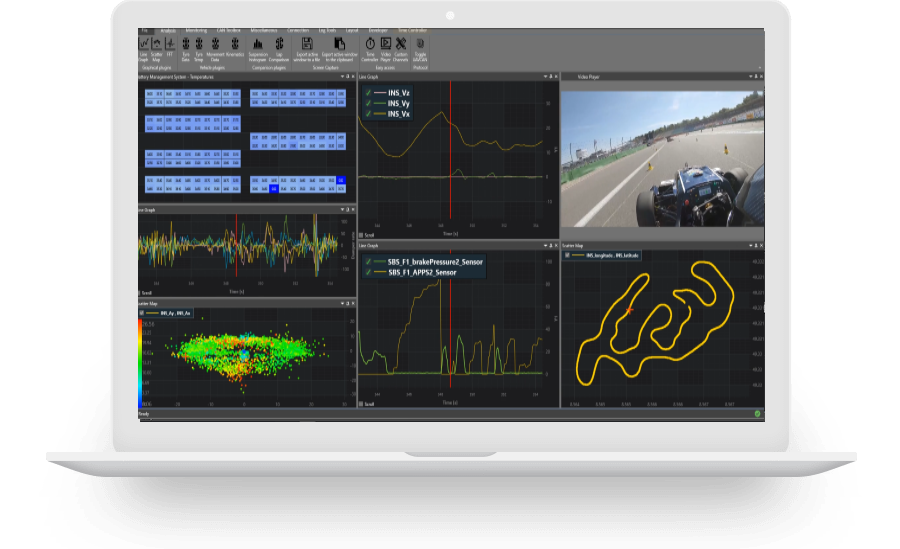
We support developers and enterprise-level WPF chart applications across a wide range of sectors, including: motorsports, healthcare, financial, trading, robotics, research and more.

Get started with our award-winning software that’s trusted by thousands of developers around the world. Make user-friendly apps or use real time data to enhance decision making across real world applications.

Start Your Free Trial

SciChart WPF chart example: realtime ticking stock charts

Want to display more data, more quickly? With SciChart, you can

For high-performance charts, we’re the charting library you want.

Displaying real-time data is all about visualizing and accessing information that is happening in the moment – whether that’s a patient’s heart-rate or the performance of a motor racing vehicle on the track. Being able to monitor and make lightning-quick decisions based on this type of data is crucial. Fast data rendering and the ability to present multiple data series simultaneously is the key to successful real-time data display.

SciChart has the fastest chart rendering on the market, outperforming even the strongest competitor by up to 39,000x more datapoints per second. Our software supports millions, even billions of data points, without slowdown. This makes us the best choice for large, complex data sets.

Ready to supercharge your real-time WPF charts?

Download your SciChart trial now

Flexible, Feature-rich Customizations

Want to display complex data sets in a succinct manner? No problem. With great levels of functionality and customizable features, you have more flexibility in how you display the data. With an infinitely extendable CustomRenderableSeries, you can tailor charts to suit your brand and specific use case.

Whether you’re looking to create a user-friendly interface with real-time data feeds or you need software that matches the speed you require, SciChart can help.

Developers can also benefit from 5-star rated support, with 98% of users recommending SciChart.


Who We Have Helped

University of Illinois: Enhanced Medical Imaging Reduced Diagnosis Time from Weeks to Hours

Industry - MedTech, Healthcare

The University of Illinois developed a high-resolution IR Spectroscopy scanner for medical imaging. Their problem: their new microscope design outputted 100x the data of a typical MRI scanner. Previous charting was only capable of displaying less than 1% of the required data points. By using SciChart WPF they were able to visualize all the data, and help their device reduce diagnosis time from weeks to hours.

Read More

Cardea Labs: Dynamic WPF Visualization of ECG signals in Realtime

Industry - MedTech, Healthcare

The owner of Cardea Labs sought SciChart’s help to iron out some performance issues with their ECG signal charts. With a vision to help poorer medical establishments in India deliver innovative and cost-effective clinical care, SciChart were more than happy to help bring their ECG signals up to speed.

Our solution?

  • FIFO functionality for a real time scrolling ECG monitor.
  • Upgraded session window to make use of Pan, Zoom & Scroll functions, making the UI intuitive and user-friendly.
  • SciChart’s High Performance capabilities could display 250 points per second.

Read More

Revolve NTNU: Visualization of data from more than 300 sensors from a race car

Industry - Motorsport, Formula Student

Revolve NTNU used SciChart’s WPF charting software to handle complex data from over 300 sensors in their race car.

How did we help?

  • SciChart’s high performance WPF charts were able to smoothly handle the data from all 300+ sensors in real time.
  • Multi-series, high-bandwidth data was interpreted and annotated with the help of rich core WPF charting API – also allowing for performance analysis and testing.
  • Combined with the comprehensive documentation and tech support, the students found our software easy to use and integrate into their custom systems.
  • Being able to compare the data during the current race with the data from the previous race, the students were able to make informed decisions in real time.

Get started with your real-time WPF charts

Ready to get started with your free 30-day trial? Read our Getting Started guide:

  • Download the examples
  • Start your free trial
  • Create charts with tutorials

Start building your high performance data visualization dashboards and web applications with a free trial of SciChart.WPF. No credit card details are required. If you need help, you can refer to our tutorials and documentation or access our dedicated support team.

Get started with your free trial today


Why Choose SciChart to Power Your WPF Charts?

In-house built hardware Xccelerator

Extensive features & customizations

World-class support for developers

98% of customers recommend SciChart

FAQs

icon

How do your real-time WPF charts compare to competitor chart libraries?

When it comes to rendering speeds, we outperform even the strongest competitor by up to 39,000x.

icon

What support do you offer developers?

With SciChart, you can benefit from an outstanding level of support. Our dedicated customer service team are specialists who have successfully helped developers working across various enterprise-level sectors.

icon

How can I find out more about the terms of your licence use?

We have a dedicated licence FAQ page which will answer all your questions. If you can’t find the answer you’re looking for, our customer service team will be more than happy to help.