SciChart WPF v8.3 Released!
We’ve moved over to a new format for communicating our releases and updates of our popular WPF Charts library, by publishing […]
This page is out of date, for up to date guide, please see the SciChart WPF Documentation on Sychronizing Multiple Charts.
An often requested demonstration is how to synchronize mouse events across charts. We have used this feature in the SciTrader demo that you can view online (Silverlight 5), but what’s lacking is a clear and consise tutorial on this topic without all the other features that SciTrader demonstrates.
So here it is! Let’s get started. You will need SciChart v1.5.x for this.
First lets start by creating a Visual Studio solution. Here at SciChart we use VS2012, however VS2010 is also supported.
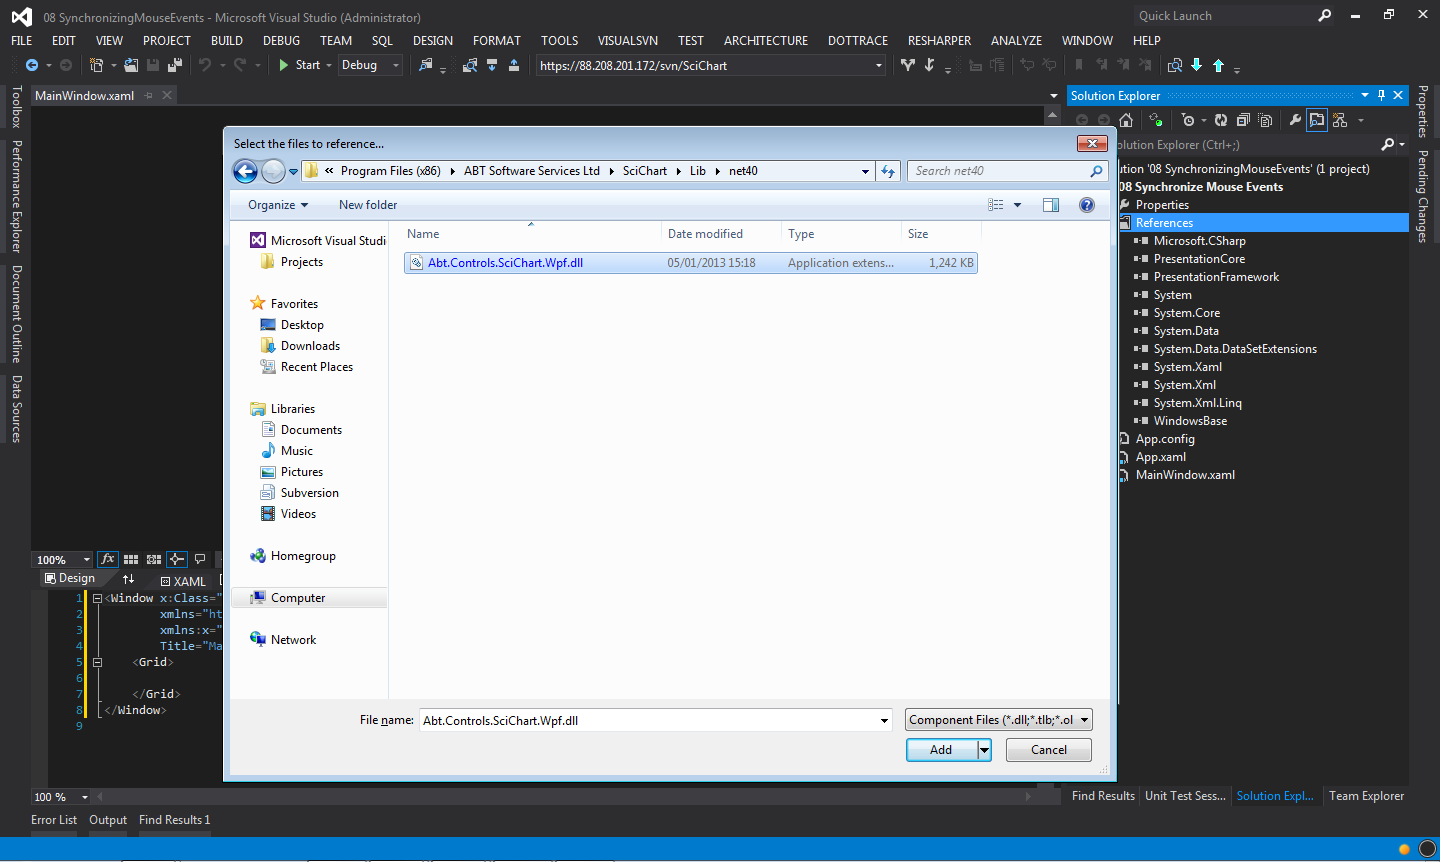
Create a new WPF project in your chosen IDE and add a reference to SciChart WPF. You can find the libraries under C:/Program Files (x86)/ABT Software Services/SciChart/Lib/
Now with the solution created, add a SciChartSurface to the MainWindow.xaml. It should build at this point. If not, double check your references, the target .NET framework and xmlns namespace declarations.
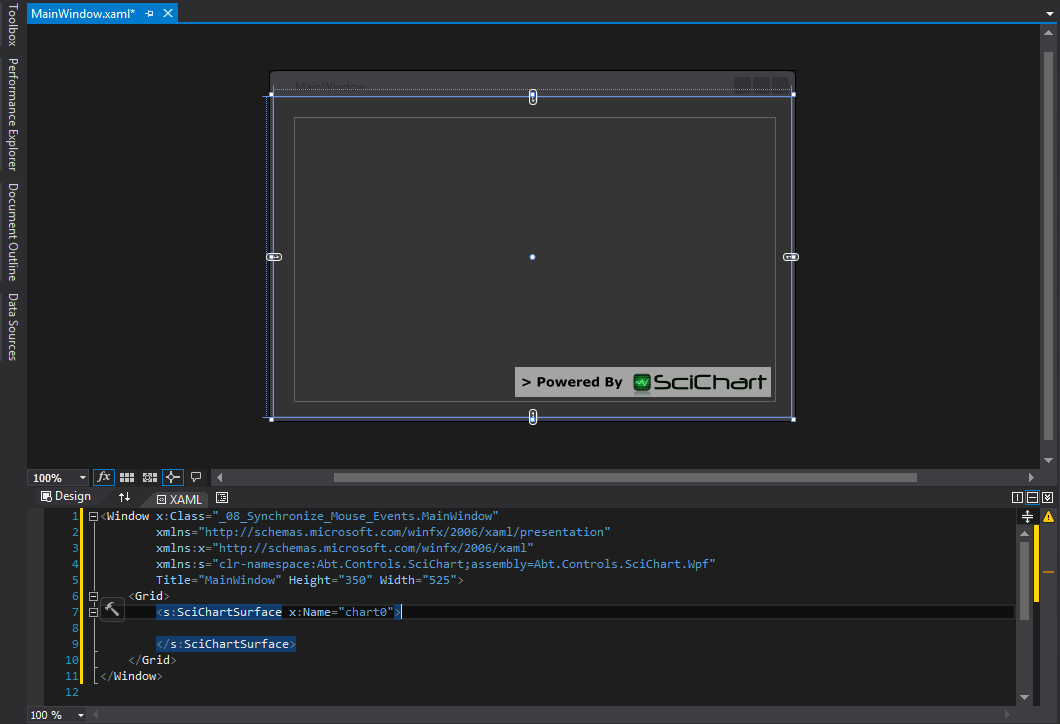
Now lets add some Axes to the chart. We will assign a VisibleRange and GrowBy properties to cause the chart to paint itself in the designer.
<Window x:Class="_08_Synchronize_Mouse_Events.MainWindow"
xmlns:x="http://schemas.microsoft.com/winfx/2006/xaml"
xmlns:s="clr-namespace:Abt.Controls.SciChart;assembly=Abt.Controls.SciChart.Wpf"
Title="MainWindow" Height="350" Width="525">
<Grid>
<s:SciChartSurface x:Name="chart0" s:ThemeManager.Theme="Chrome" Padding="30">
<s:SciChartSurface.RenderableSeries>
<s:FastLineRenderableSeries SeriesColor="DarkBlue"/>
</s:SciChartSurface.RenderableSeries>
<s:SciChartSurface.YAxis>
<s:NumericAxis VisibleRange="0,1" GrowBy="0.1,0.1"></s:NumericAxis>
</s:SciChartSurface.YAxis>
<s:SciChartSurface.XAxis>
<s:NumericAxis VisibleRange="0,1" GrowBy="0.1,0.1"></s:NumericAxis>
</s:SciChartSurface.XAxis>
</s:SciChartSurface>
</Grid>
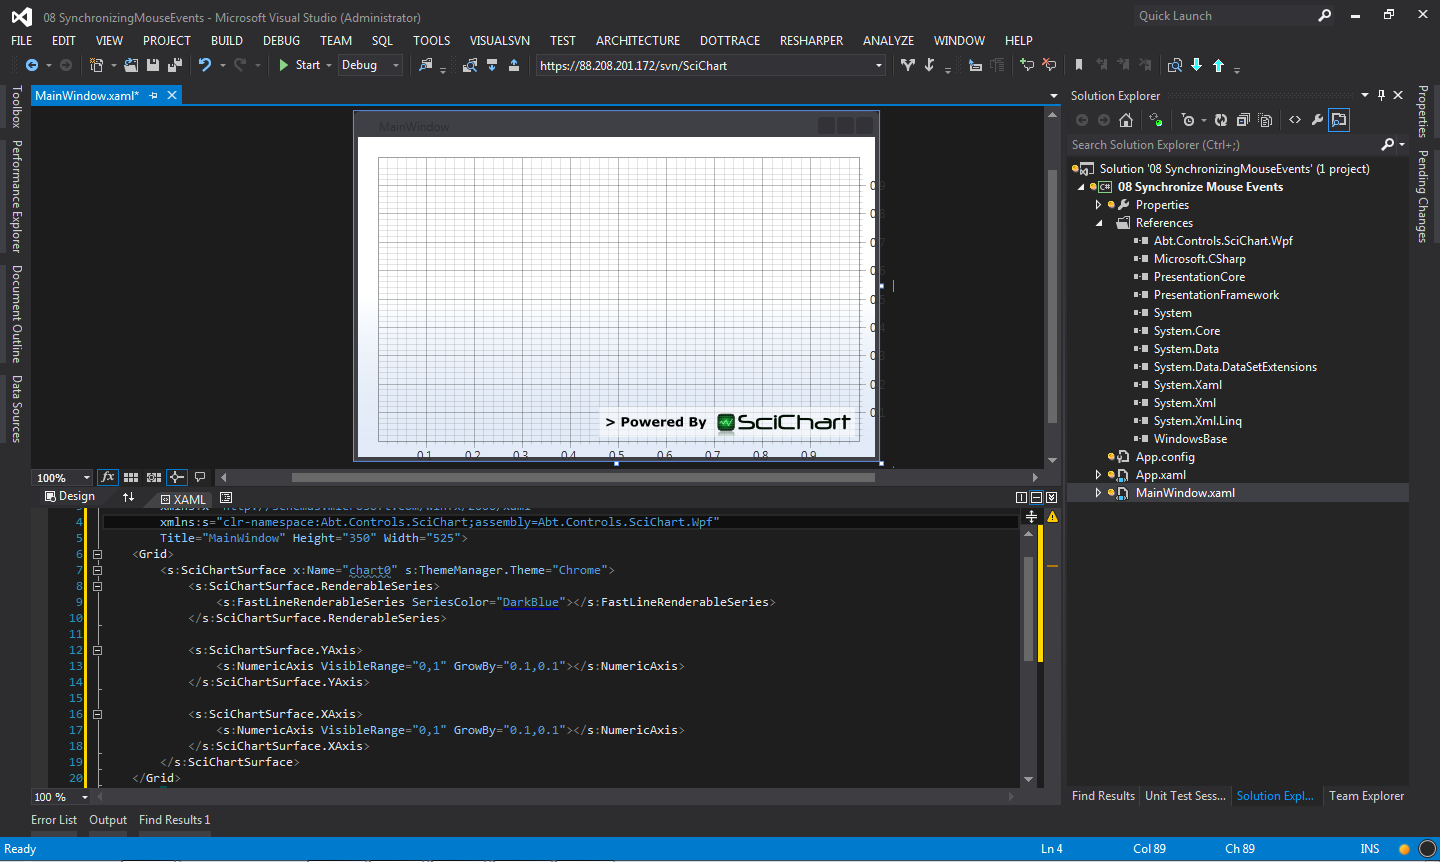
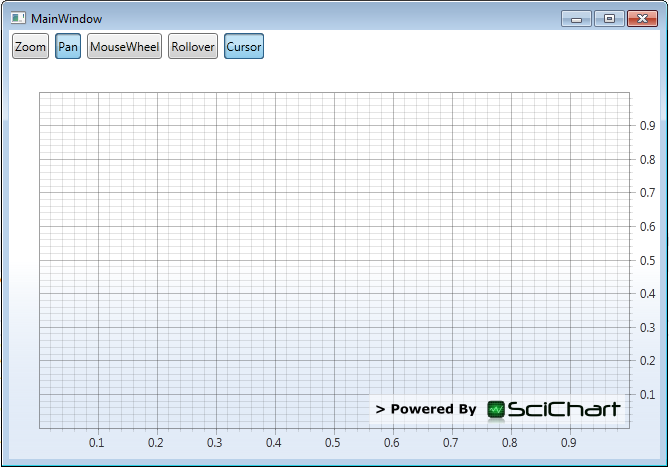
</Window>You should now be looking at something a little like this:
So the point of this tutorial is to share mouse events across charts, so lets add the ChartModifiers. We’re going to add the following:
Add the following Xaml inside your SciChartSurface tag:
            <s:SciChartSurface.ChartModifier>
                <s:ModifierGroup>
                    <s:RubberBandXyZoomModifier IsEnabled="{Binding ZoomEnabled, Mode=TwoWay}" IsXAxisOnly="True"></s:RubberBandXyZoomModifier>
                    <s:ZoomPanModifier IsEnabled="{Binding PanEnabled, Mode=TwoWay}"></s:ZoomPanModifier>
                    <s:MouseWheelZoomModifier IsEnabled="{Binding MouseWheelEnabled, Mode=TwoWay}"></s:MouseWheelZoomModifier>
                    <s:RolloverModifier IsEnabled="{Binding RolloverEnabled, Mode=TwoWay}"></s:RolloverModifier>
                    <s:CursorModifier IsEnabled="{Binding CursorEnabled, Mode=TwoWay}"></s:CursorModifier>
                    <s:YAxisDragModifier></s:YAxisDragModifier>
                    <s:XAxisDragModifier></s:XAxisDragModifier>
                    <s:ZoomExtentsModifier></s:ZoomExtentsModifier>
                </s:ModifierGroup>
            </s:SciChartSurface.ChartModifier>
This puts the modifiers on the chart inside a ModifierGroup. The behaviour is as follows. The first modifier in the group receives a mouse event (Mouse Down, Up, Move, Wheel, DoubleClick). If it handles it, it prevents modifiers further down the group from receiving the same event (we will see later, a way to override this behaviour). Each modifier attaches specific mouse interaction behaviour to the chart, such as Zooming or Panning, has an IsEnabled property (which may be bound to). You can even create your own modifiers by deriving from ChartModifierBase.
So what now? You will notice we put some bindings in there, so we need a MainViewModel to bind to to enable toggling of the modifiers in unison.
You don’t have to do this in MVVM, but we recommend it. If you want to enable or disable chart modifiers via code behind, simply give your modifiers an x:Name attribute and set modifier.IsEnabled = true or false.
In MVVM we can bind directly to a Boolean property. This allows us to turn on or off multiple modifiers at once, and bind to other UI such as toggle buttons. Create a viewmodel like this with our modifier properties in. Here we implement INotifyPropertyChanged, but you can also use an MVVM framework such as Mvvm Lite and inherit from their base viewmodel.
    public class MultiChartMouseEventsViewModel : INotifyPropertyChanged
    {
        private bool mouseWheelEnabled;
        private bool panEnabled;
        private bool rolloverEnabled;
        private bool cursorEnabled;
        private bool zoomEnabled;

        public MultiChartMouseEventsViewModel()
        {
            // Set default states of modifiers
            this.MouseWheelEnabled = false;
            this.PanEnabled = true;
            this.CursorEnabled = true;
        }

        public bool MouseWheelEnabled
        {
            get { return mouseWheelEnabled; }
            set
            {
                if (mouseWheelEnabled == value) return;
                mouseWheelEnabled = value;
                OnPropertyChanged("MouseWheelEnabled");
            }
        }

        public bool PanEnabled
        {
            get { return panEnabled; }
            set
            {
                if (panEnabled == value) return;
                panEnabled = value;
                OnPropertyChanged("PanEnabled");

                // Toggle Zoom off
                ZoomEnabled = !PanEnabled;
            }
        }

        public bool ZoomEnabled
        {
            get { return zoomEnabled; }
            set
            {
                if (zoomEnabled == value) return;
                zoomEnabled = value;
                OnPropertyChanged("ZoomEnabled");

                // Toggle pan off
                PanEnabled = !ZoomEnabled;
            }
        }

        public bool CursorEnabled
        {
            get { return cursorEnabled; }
            set
            {
                if (cursorEnabled == value) return;
                cursorEnabled = value;
                OnPropertyChanged("CursorEnabled");

                // Toggle RolloverEnabled off
                RolloverEnabled = !CursorEnabled;
            }
        }

        public bool RolloverEnabled
        {
            get { return rolloverEnabled; }
            set
            {
                if (rolloverEnabled == value) return;
                rolloverEnabled = value;
                OnPropertyChanged("RolloverEnabled");

                // Toggle RolloverEnabled off
                CursorEnabled = !RolloverEnabled;
            }
        }
        public event PropertyChangedEventHandler PropertyChanged;

        protected virtual void OnPropertyChanged(string propertyName)
        {
            PropertyChangedEventHandler handler = PropertyChanged;
            if (handler != null) handler(this, new PropertyChangedEventArgs(propertyName));
        }
}In order to turn the modifiers on and off, lets create a toolbar and bind to viewmodel properties. First, modify the xaml in the MainWindow.xaml to include some rows in the grid:
<Window x:Class="Abt.Controls.SciChart.Wpf.TestSuite.ExampleSandbox.MultiChartMouseEvents.MultiChartMouseEvents"

        xmlns:x="http://schemas.microsoft.com/winfx/2006/xaml"
        xmlns:s="clr-namespace:Abt.Controls.SciChart;assembly=Abt.Controls.SciChart.Wpf"
        Title="MultiChartMouseEvents" Height="400" Width="600">

    <Grid>
        <Grid.RowDefinitions>
            <RowDefinition Height="32"></RowDefinition>
            <RowDefinition Height="*"></RowDefinition>
            <RowDefinition Height="*"></RowDefinition>
        </Grid.RowDefinitions>

        <!-- Define Toolbar -->
        <StackPanel Grid.Row="0" Orientation="Horizontal">
            <ToggleButton Content="Zoom" Margin="3"
                          IsChecked="{Binding ZoomEnabled, Mode=TwoWay}"/>
            <ToggleButton Content="Pan" Margin="3"
                          IsChecked="{Binding PanEnabled, Mode=TwoWay}"/>
            <ToggleButton Content="MouseWheel" Margin="3"
                          IsChecked="{Binding MouseWheelEnabled, Mode=TwoWay}"/>
            <ToggleButton Content="Rollover" Margin="3"
                          IsChecked="{Binding RolloverEnabled, Mode=TwoWay}"/>
            <ToggleButton Content="Cursor" Margin="3"
                          IsChecked="{Binding CursorEnabled, Mode=TwoWay}" />
        </StackPanel>

        <s:SciChartSurface x:Name="chart0" Grid.Row="1" s:ThemeManager.Theme="Chrome" Padding="30">
        <!-- ... -->
Next, lets ensure that the MainWindow.xaml has a viewmodel declared and sets the datacontext on the grid.
<!-- Note, your namespace for the viewmodel may be different.  -->
<Window x:Class="_08_Synchronize_Mouse_Events.MainWindow"

        xmlns:x="http://schemas.microsoft.com/winfx/2006/xaml"
        xmlns:s="clr-namespace:Abt.Controls.SciChart;assembly=Abt.Controls.SciChart.Wpf"
        xmlns:SynchronizeMouseEvents="clr-namespace:_08_Synchronize_Mouse_Events"
        Title="MainWindow" Height="350" Width="525">

    <Window.Resources>
        <SynchronizeMouseEvents:MultiChartMouseEventsViewModel x:Key="ViewModel"/>
    </Window.Resources>

    <!-- Ensure Grid.DataContext is set to the viewmodel instance -->
    <Grid DataContext="{StaticResource ViewModel}">
Note: There’s a myriad ways to create and bind to a viewmodel, this is the easiest for sake of demonstration, and also works in the Visual Studio designer! Don’t be confused by the syntax if you’re not familiar with binding. What this means is, create an instance of MultiChartMouseEventViewModel and set grid.DataContext equal to that instance.
If you run the application now, you should be able to see something like this. The toggle buttons should flip between Zoom/Pan and Rollover/Cursor and the default behaviour should be the cursor modifier. Don’t worry that the chart doesn’t zoom and pan just yet, we need to add some data.
We’re not far off having a working charting application, albeit with one chart. To finish the job, let’s add some data. We do this by binding the SciChartSurface to the ViewModel and creating DataSeriesSet properties in the viewmodel.
First, set up this binding in the view:
        <s:SciChartSurface x:Name="chart0" Grid.Row="1" s:ThemeManager.Theme="Chrome" Padding="30"
                           DataSet="{Binding ChartData0}">
            <!-- ... -->
And this code in the ViewModel:
public class MultiChartMouseEventsViewModel : INotifyPropertyChanged
{
private bool mouseWheelEnabled;
private bool panEnabled;
private bool rolloverEnabled;
private bool cursorEnabled;
private bool zoomEnabled;
private readonly IDataSeriesSet _chartData0;
public MultiChartMouseEventsViewModel()
{
// Create a dataset which we will bind to
_chartData0 = CreateDataset();
// Set default states of modifiers
this.MouseWheelEnabled = false;
this.PanEnabled = true;
this.CursorEnabled = true;
}
private IDataSeriesSet CreateDataset()
{
var ds = new DataSeriesSet<double, double>();
var ds0 = ds.AddSeries();
const int count = 1000;
for (int i = 0; i < count; i++)
{
ds0.Append(i, count * Math.Sin(i * Math.PI * 0.1) / i);
}
return ds;
}
public IDataSeriesSet ChartData0 { get { return _chartData0; } }
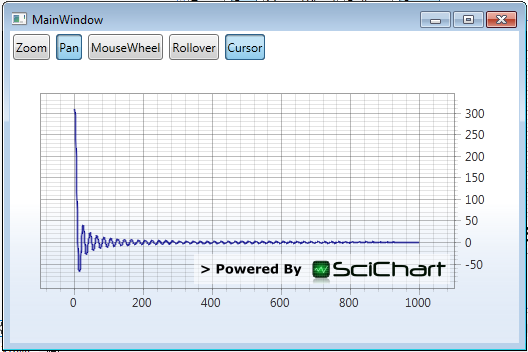
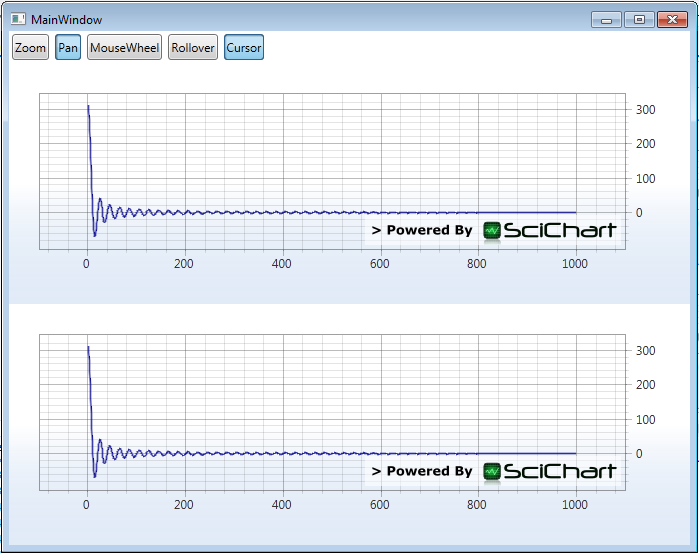
// ... etcNow if you run your application and double click on the chart to zoom to extents, you should see this:
Don’t see it? Here are some tips to debug why the chart is not showing:
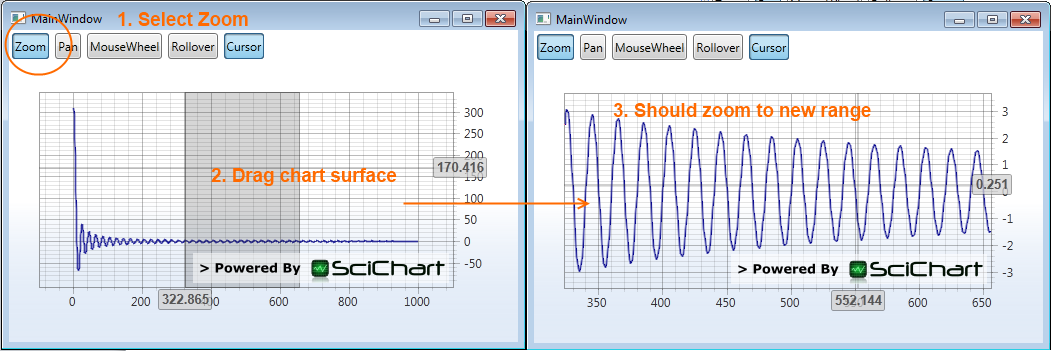
If you got this far you should now be able to perform the following actions on the chart.
Now to the observant you will notice the title of the tutorial is “Synchronizing Mouse Events across charts”, so I guess we should add another chart!
To do this, simply copy & paste the entire tag, but renaming variables, e.g. chart0 to chart1, Grid.Row=”1” to Grid.Row=”2” and binding to ChartData0 to ChartData1. Also add another row in the parent Grid to host the chart. Your entire Xaml should now look like this:
<Window x:Class="_08_Synchronize_Mouse_Events.MainWindow"

        xmlns:x="http://schemas.microsoft.com/winfx/2006/xaml"
        xmlns:s="clr-namespace:Abt.Controls.SciChart;assembly=Abt.Controls.SciChart.Wpf"
        xmlns:SynchronizeMouseEvents="clr-namespace:_08_Synchronize_Mouse_Events"
        Title="MainWindow" Height="350" Width="525">

    <Window.Resources>
        <SynchronizeMouseEvents:MultiChartMouseEventsViewModel x:Key="ViewModel"/>
    </Window.Resources>

    <Grid DataContext="{StaticResource ViewModel}">
        <Grid.RowDefinitions>
            <RowDefinition Height="32"></RowDefinition>
            <RowDefinition Height="*"></RowDefinition>
            <RowDefinition Height="*"></RowDefinition>
        </Grid.RowDefinitions>

        <!-- Define Toolbar -->
        <StackPanel Grid.Row="0" Orientation="Horizontal">
            <ToggleButton Content="Zoom" Margin="3"
                          IsChecked="{Binding ZoomEnabled, Mode=TwoWay}"/>
            <ToggleButton Content="Pan" Margin="3"
                          IsChecked="{Binding PanEnabled, Mode=TwoWay}"/>
            <ToggleButton Content="MouseWheel" Margin="3"
                          IsChecked="{Binding MouseWheelEnabled, Mode=TwoWay}"/>
            <ToggleButton Content="Rollover" Margin="3"
                          IsChecked="{Binding RolloverEnabled, Mode=TwoWay}"/>
            <ToggleButton Content="Cursor" Margin="3"
                          IsChecked="{Binding CursorEnabled, Mode=TwoWay}"  />
        </StackPanel>

        <!-- Define the first chart -->
        <s:SciChartSurface x:Name="chart0" Grid.Row="1" s:ThemeManager.Theme="Chrome" Padding="30"
                           DataSet="{Binding ChartData0}">
            <s:SciChartSurface.RenderableSeries>
                <s:FastLineRenderableSeries SeriesColor="DarkBlue"></s:FastLineRenderableSeries>
            </s:SciChartSurface.RenderableSeries>

            <s:SciChartSurface.YAxis>
                <s:NumericAxis VisibleRange="0,1" GrowBy="0.1,0.1"></s:NumericAxis>
            </s:SciChartSurface.YAxis>

            <s:SciChartSurface.XAxis>
                <s:NumericAxis VisibleRange="0,1" GrowBy="0.1,0.1"></s:NumericAxis>
            </s:SciChartSurface.XAxis>

            <s:SciChartSurface.ChartModifier>
                <s:ModifierGroup>
                    <s:RubberBandXyZoomModifier IsEnabled="{Binding ZoomEnabled, Mode=TwoWay}" IsXAxisOnly="True"/>
                    <s:ZoomPanModifier IsEnabled="{Binding PanEnabled, Mode=TwoWay}"/>
                    <s:MouseWheelZoomModifier IsEnabled="{Binding MouseWheelEnabled, Mode=TwoWay}"/>
                    <s:RolloverModifier IsEnabled="{Binding RolloverEnabled, Mode=TwoWay}"/>
                    <s:CursorModifier IsEnabled="{Binding CursorEnabled, Mode=TwoWay}"/>
                    <s:YAxisDragModifier></s:YAxisDragModifier>
                    <s:XAxisDragModifier></s:XAxisDragModifier>
                    <s:ZoomExtentsModifier></s:ZoomExtentsModifier>
                </s:ModifierGroup>
            </s:SciChartSurface.ChartModifier>
        </s:SciChartSurface>

        <!-- Define the second chart -->
        <s:SciChartSurface x:Name="chart1" Grid.Row="2" s:ThemeManager.Theme="Chrome" Padding="30"
                           DataSet="{Binding ChartData1}">
            <s:SciChartSurface.RenderableSeries>
                <s:FastLineRenderableSeries SeriesColor="DarkBlue"></s:FastLineRenderableSeries>
            </s:SciChartSurface.RenderableSeries>

            <s:SciChartSurface.YAxis>
                <s:NumericAxis VisibleRange="0,1" GrowBy="0.1,0.1"></s:NumericAxis>
            </s:SciChartSurface.YAxis>

            <s:SciChartSurface.XAxis>
                <s:NumericAxis VisibleRange="0,1" GrowBy="0.1,0.1"></s:NumericAxis>
            </s:SciChartSurface.XAxis>

            <s:SciChartSurface.ChartModifier>
                <s:ModifierGroup>
                    <s:RubberBandXyZoomModifier IsEnabled="{Binding ZoomEnabled, Mode=TwoWay}" IsXAxisOnly="True"></s:RubberBandXyZoomModifier>
                    <s:ZoomPanModifier IsEnabled="{Binding PanEnabled, Mode=TwoWay}"></s:ZoomPanModifier>
                    <s:MouseWheelZoomModifier IsEnabled="{Binding MouseWheelEnabled, Mode=TwoWay}"></s:MouseWheelZoomModifier>
                    <s:RolloverModifier IsEnabled="{Binding RolloverEnabled, Mode=TwoWay}"></s:RolloverModifier>
                    <s:CursorModifier IsEnabled="{Binding CursorEnabled, Mode=TwoWay}"></s:CursorModifier>
                    <s:YAxisDragModifier></s:YAxisDragModifier>
                    <s:XAxisDragModifier></s:XAxisDragModifier>
                    <s:ZoomExtentsModifier></s:ZoomExtentsModifier>
                </s:ModifierGroup>
            </s:SciChartSurface.ChartModifier>
        </s:SciChartSurface>
    </Grid>
</Window>
In Code-behind, add a Loaded event handler to zoom the two charts to extents on startup:
    /// <summary>
    /// Interaction logic for MainWindow.xaml
    /// </summary>
    public partial class MainWindow : Window
    {
        public MainWindow()
        {
            InitializeComponent();
            this.Loaded += MainWindow_Loaded;
        }

        private void MainWindow_Loaded(object sender, RoutedEventArgs e)
        {
            chart0.AnimateZoomExtents(TimeSpan.FromMilliseconds(1500));
            chart1.AnimateZoomExtents(TimeSpan.FromMilliseconds(1500));
        }
    }
And in the ViewModel ensure you have two DataSeriesSet properties for the two charts:
public MultiChartMouseEventsViewModel()
{
// Create two datasets which we will bind to
_chartData0 = CreateDataset();
_chartData1 = CreateDataset();
// Set default states of modifiers
this.MouseWheelEnabled = false;
this.PanEnabled = true;
this.CursorEnabled = true;
// ...
}
public IDataSeriesSet ChartData0 { get { return _chartData0; } }
public IDataSeriesSet ChartData1 { get { return _chartData1; } }
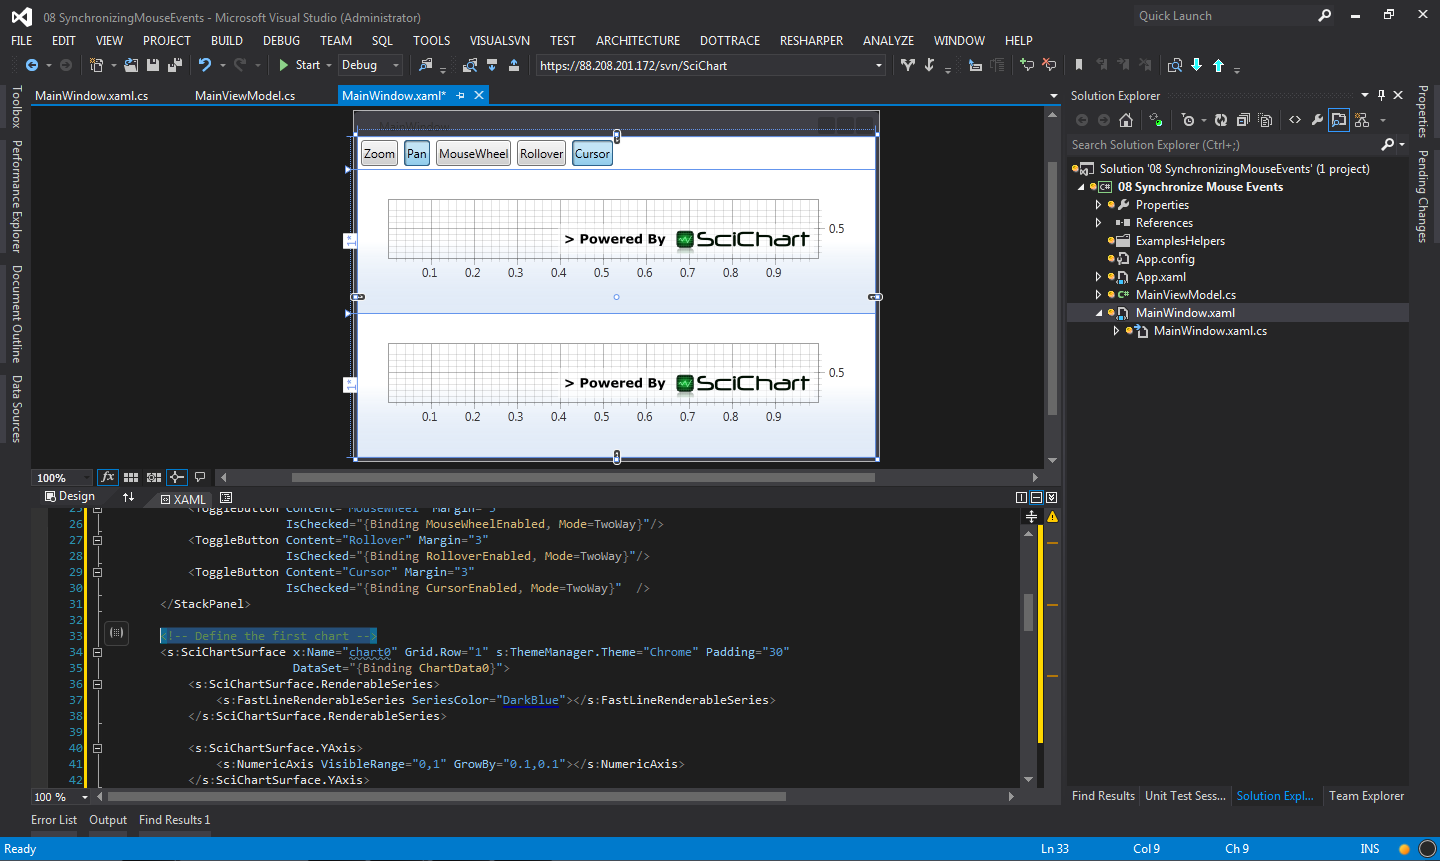
// ...In the designer window in Visual Studio you should see something like this
And when you run the application, something like this:
Although the application looks good, you will notice the two charts don’t have their mouse events synchronized. To do this we need to make a few changes to the Xaml and the ViewModel.
Bind both XAxis VisibleRanges to a shared property in the viewmodel. This serves the purpose that any change on one chart moves the XAxis of the other chart to match it.
View (Note, ensure this binding is on both charts XAxis)
        <!-- Define the Nth chart -->
        <s:SciChartSurface x:Name="chart1" Grid.Row="2" s:ThemeManager.Theme="Chrome" Padding="30"
                           DataSet="{Binding ChartData1}">
        <!-- ... -->
            <s:SciChartSurface.XAxis>
                <s:NumericAxis VisibleRange="{Binding SharedXVisibleRange, Mode=TwoWay}" GrowBy="0.1,0.1"/>
            </s:SciChartSurface.XAxis>
        <!-- ... -->
ViewModel
    public class MultiChartMouseEventsViewModel : INotifyPropertyChanged
    {
        private bool mouseWheelEnabled;
        private bool panEnabled;
        private bool rolloverEnabled;
        private bool cursorEnabled;
        private bool zoomEnabled;
        private IRange sharedXVisibleRange;
        private readonly IDataSeriesSet _chartData0;
        private readonly IDataSeriesSet _chartData1;

        public MultiChartMouseEventsViewModel()
        {
            // Create two datasets which we will bind to
            _chartData0 = CreateDataset();
            _chartData1 = CreateDataset();

            // Set default states of modifiers
            this.MouseWheelEnabled = false;
            this.PanEnabled = true;
            this.CursorEnabled = true;

            // Set default shared XAxis VisibleRange which multiple charts will bind to
            SharedXVisibleRange = new DoubleRange(0, 1);
        }

        public IRange SharedXVisibleRange
        {
            get { return sharedXVisibleRange; }
            set
            {
                if (sharedXVisibleRange == value) return;
                sharedXVisibleRange = value;
                OnPropertyChanged("SharedXVisibleRange");
            }
        }
        // ...
Next, Use the MouseManager.MouseEventGroup on the ModifierGroups of both charts. This serves the purpose to pass mouse events between one chart and another, regardless of which chart started the mouse-event.
<s:SciChartSurface.ChartModifier>
    <s:ModifierGroup mouse:MouseManager.MouseEventGroup="MyCustomGroup">
Now running the application you should see that mouse events and chart modifiers are shared across the chart!
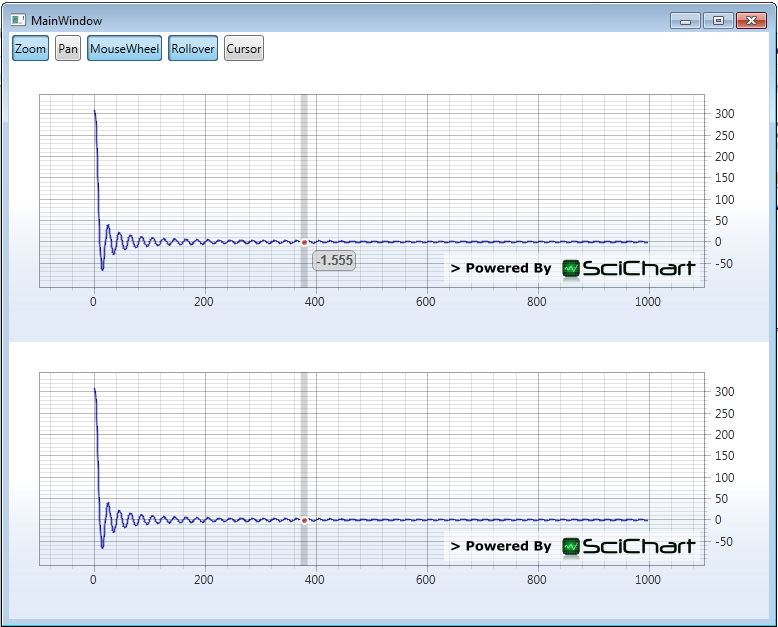
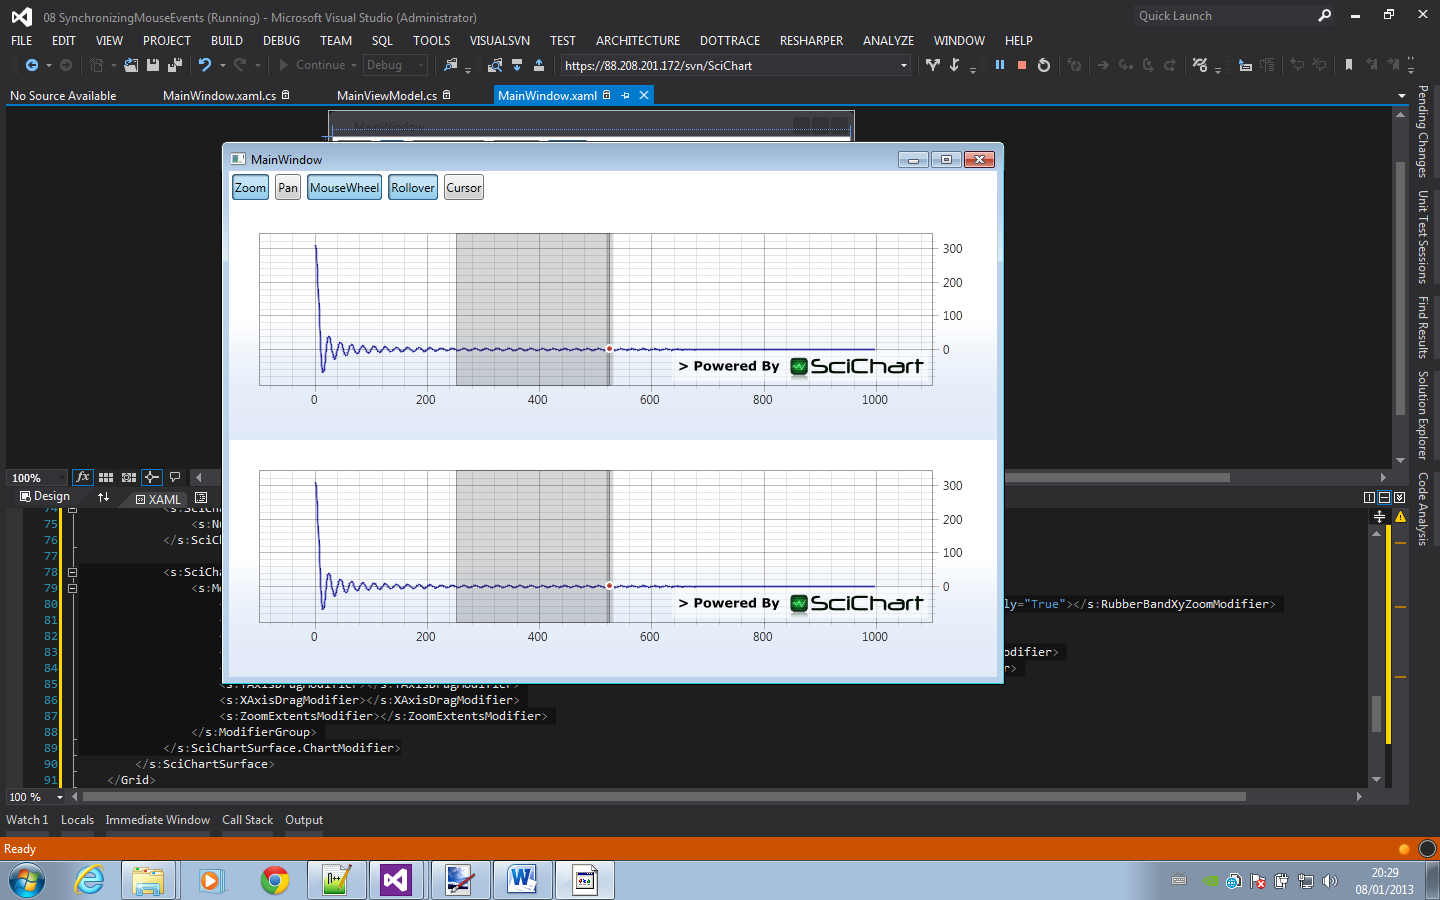
But wait, there are a few quirks. Notice if you select Pan mode, and drag to pan, the rollover or cursor on one chart freezes?
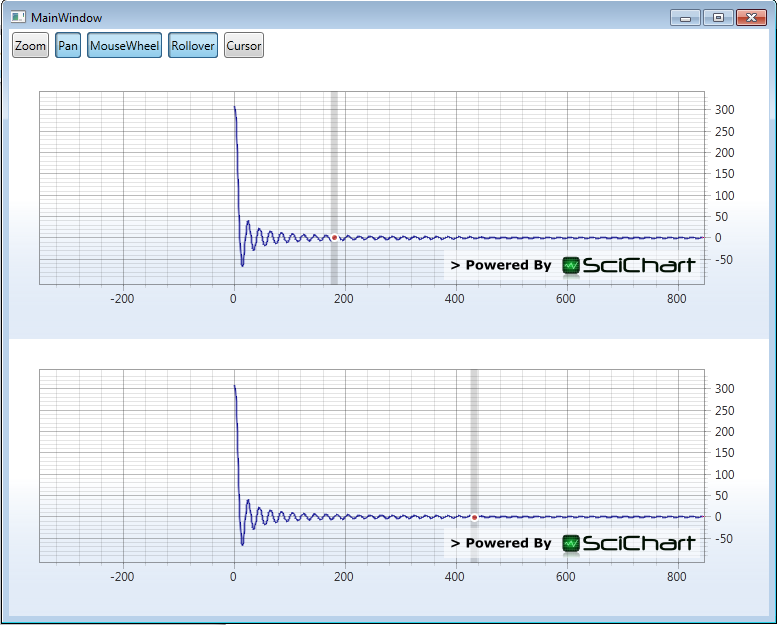
Also notice if you zoom using the Rubber Band then only one chart has the zoom rectangle on it?
Let’s continue by fixing these quirks before we call the example done.
The MouseManager works in a similar way to the WPF tunnelling events. If you have N ChartModifiers in a ModifierGroup, and one modifier sets e.Handled=true, then subsequent modifiers will not receive the event.
To override this behaviour, we can set the ReceiveHandledEvents property to true on chart modifiers:
            <s:SciChartSurface.ChartModifier>
                <s:ModifierGroup mouse:MouseManager.MouseEventGroup="MyCustomGroup">
                    <s:RubberBandXyZoomModifier ReceiveHandledEvents="True" IsEnabled="{Binding ZoomEnabled, Mode=TwoWay}" IsXAxisOnly="True"></s:RubberBandXyZoomModifier>
                    <s:ZoomPanModifier IsEnabled="{Binding PanEnabled, Mode=TwoWay}"></s:ZoomPanModifier>
                    <s:MouseWheelZoomModifier IsEnabled="{Binding MouseWheelEnabled, Mode=TwoWay}"></s:MouseWheelZoomModifier>
                    <s:RolloverModifier ReceiveHandledEvents="True" IsEnabled="{Binding RolloverEnabled, Mode=TwoWay}"></s:RolloverModifier>
                    <s:CursorModifier ReceiveHandledEvents="True" IsEnabled="{Binding CursorEnabled, Mode=TwoWay}"></s:CursorModifier>
                    <s:YAxisDragModifier></s:YAxisDragModifier>
                    <s:XAxisDragModifier></s:XAxisDragModifier>
                    <s:ZoomExtentsModifier></s:ZoomExtentsModifier>
                </s:ModifierGroup>
            </s:SciChartSurface.ChartModifier>
Note: set this property on the modifiers on both Chart Surfaces
Next run the app – you should see it behaves as expected, et voila! Mouse events are shared across charts!
This tutorial in Word Doc and Source code form can be downloaded along with the SciChart Trial at www.scichart.com/downloads/
Note this requires free registration with the site to get the tutorial.
For your convenience, we’ve also included the SynchronizeMouseEvents tutorial source code here. however note it doens’t have the SciChart binaries, you’ll need to get those off the downloads page.
Thanks and enjoy!
Related Posts
![]()
Queens Award for Innovation
Proud winners of the Queens Award for Innovation, 2019. Awarded on account of our innovative graphics engine which underpins the SciChart library and enables our world-beating charting performance
![]()
National Business Awards
Highly Commended for Lloyds National Business Awards, 2019. Awarded on account of our innovative graphics engine and impressive customer base

Reviews
SciChart has received hundreds of verified, 3rd party reviews
Start a trial and discover why we are the choice
of demanding developers worldwide